
Tesla is in the news, with lots of discussion amongst traders as to what’s next in the stock. We’ll look at what the options market is expecting in terms of the magnitude of an upcoming stock move. We’ll also look at how spreads might be used in a high-premium environment to reduce capital outlay – whatever your trading view.
The Expected Move
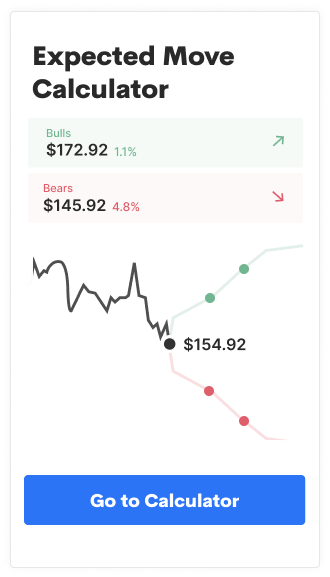
First, a look at how options are pricing potential moves in the stock for the next few weeks, via Options AI:
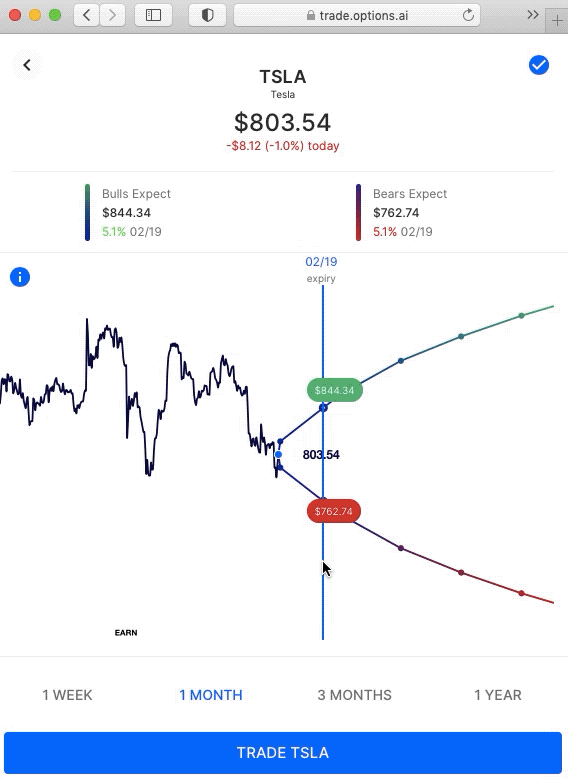
With Tesla (TSLA) trading about $800, the options market is pricing an expected move for the next month of about $100 in either direction (as shown at the end of the chart). The move being priced in options corresponds to about $900 for a bullish consensus and $700 bearish:
High Premium Stock and Option Trades.
The Options AI expected move chart helps traders visualize just how much volatility option traders are pricing into a stock like TSLA and in what timeframe. And when the expected move is large, and the stock has a high price (numerically), it follows that buying options can be expensive.
Using TSLA as an example, we can see how option spreads might be used to reduce capital outlay and potentially improve probability of profits (versus buying outright calls or puts). We will also look at how the expected move can be used to help guide strike selection on spreads, both debit, and credit.
Please note, any stocks and/or trading strategies referenced are for informational and educational purposes only and should in no way be construed as recommendations. The strategies depicted represent just a few of the many potential ways that options might be used to express any particular view. All prices are approximate at the time of writing. Option spreads involve additional risks that should be fully understood prior to investing.
Put Spreads vs Outright Puts in High Premium Stocks
With the stock trading near $800, the at-the-money Tesla March 19th 800 put is approximately $62. Buying that put outright would mean risking $6,200 (to buy 1 contract) and would need the stock below 738 to be profitable at expiry.
The Tesla March 19th 700 put is approximately $26. Buying that Put outright would mean risking $2,600 (to buy 1 contract) and would need the stock below 674 to be profitable at expiry.
Knowing that the options market is pricing a move of about $100 in either direction into March we will now look at an example of a bearish March 19th +800/-700 Debit Put Spread (buying one 800 put while selling one 700 put). At the time of writing, this was trading at approximately $36. Here’s how that trade looks on the Options AI chart:
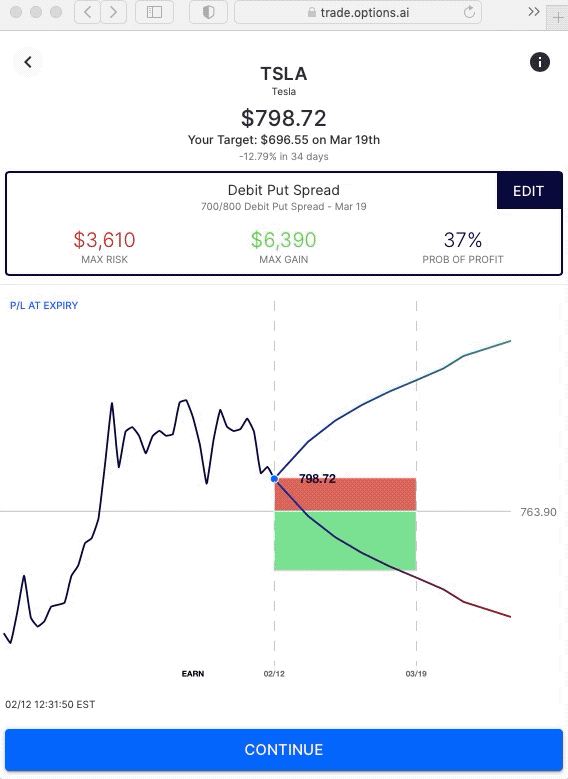
The at-the-money Put costs approximately $6,200 and the lower probability out-of-the-money put costs approximately $2,600. With a spread, the out-of-the-money Put is sold to help finance the purchase of the at-the-money Put. The Put Spread costs around $3,600, and establishes a breakeven much closer to the current stock price than if either put was bought outright.
The same process can be applied to Bullish Debit Spreads, with the TSLA March 19th 800/900 call spread trading at a similar price.
Bullish Credit Spreads: ‘Selling to the Bears’
Even by using a debit spread to reduce trade costs in an $800 stock, capital outlay can still be relatively high. Now we’ll dive into credit spreads, with a focus on an out-of-the-money Credit Spread that can utilize a higher probability of profit, while potentially reducing the capital at risk. Remember, this should be balanced with an understanding of other risks specific to spreads (such as assignment and execution risk).
Below is an example of a Credit Put Spread, placed at the bearish expected move:
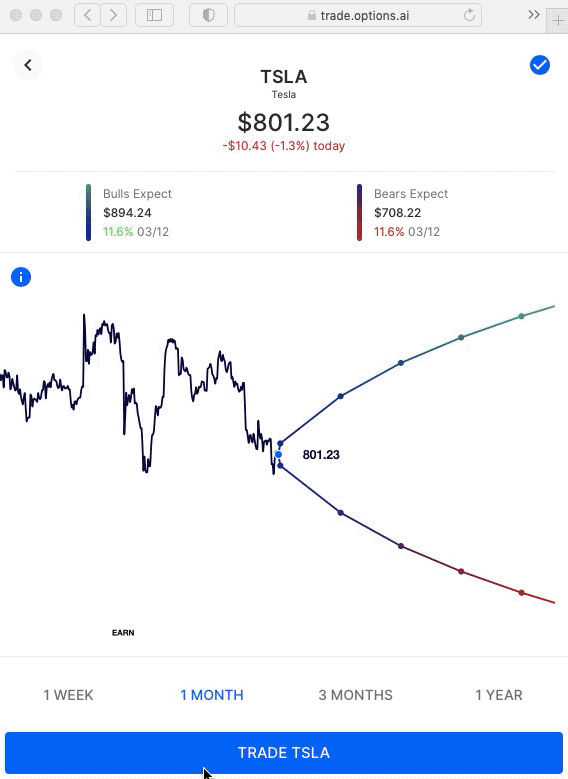
In this example, the Credit Spread sells the 700 put and buys the 690 put (March 19th). This creates a credit spread, that collects about $230, as long as the stock is above $700 on expiry. With this credit spread, more has to be risked ($770) than the potential reward ($230). But, because the trade only needs the stock to be above $700 on expiry, it carries a high probability of profit.
This “bullish by not being bearish” stance is one way traders can express a view in an 800 dollar stock without the high costs associated of trading options nearer to the current stock price. On a credit spread, the defined ‘risk’, can be thought of similarly to the ‘cost’ one would associate with a long option or a debit spread.
The same view can be expressed for bearish positioning, in this case with the 800/810 credit calls spread at a similar cost/risk.
Selling a credit to both the Bulls and the Bears
Finally, let’s consider the scenario where you believe that the options market is overpricing the move in both directions and believe that a stock will stay within the expected move on a given timeframe. Rather than “not bearish” or “not bullish” like the Credit Spreads above, this is a trade that ‘sells the move’ to both the bulls and the bears – the Iron Condor. Here’s an example, using the stock’s expected move to initially set strikes:
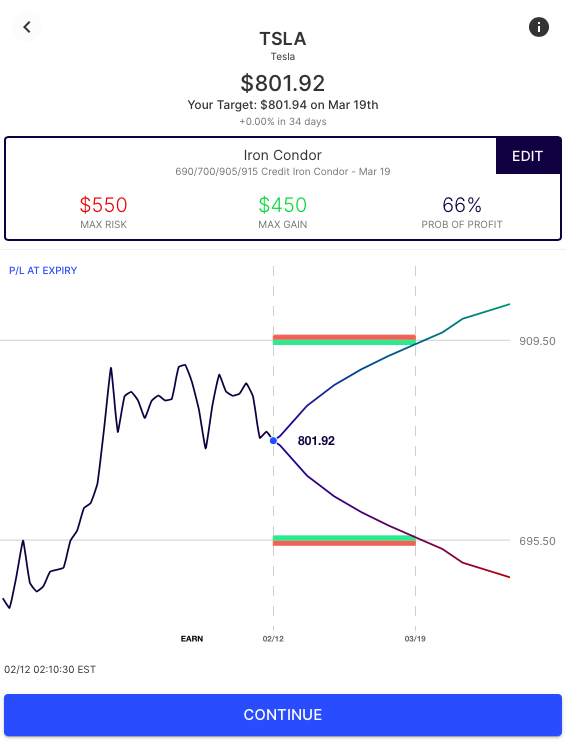
The Iron condor, which involves simultaneously selling an out-the-money Credit Call Spread, and a Credit Put Spread seeks to collect the premium (income) received if TSLA stays within its expected move.
Summary
Remember, the above are just examples of the many ways a trader might express a view using options. They are based on where the stock is trading at the time of writing and are intended solely to demonstrate how the expected move can help provide actionable insight to consider before making any trade – particularly into an uncertain event – and how it might be used for more informed strike selection. Learn / Options AI has a couple of free tools, including an earnings calendar with expected moves, as well as education on expected moves and spread trading. The concepts shown in Tesla can apply to any stock and are simply used here for illustrative purposes.


[…] Beyond the overall volatility in the broader markets, former story stocks like Tesla continued to come under selling pressure. With the stock near $600, Tesla (NASDAQ: TSLA) options are now pricing in an expected move for this week of about 9% and more than 15% for the month of March. We last detailed Tesla and how spreads could lessen costs while defining risk when the stock was near $800. (you can read more about that here). […]
[…] Beyond the overall volatility in the broader markets, former story stocks like Tesla continued to come under selling pressure. With the stock near $600, Tesla (NASDAQ: TSLA) options are now pricing in an expected move for this week of about 9% and more than 15% for the month of March. We last detailed Tesla and how spreads could lessen costs while defining risk when the stock was near $800. (you can read more about that here). […]
[…] Beyond the overall volatility in the broader markets, former story stocks like Tesla continued to come under selling pressure. With the stock near $600, Tesla (NASDAQ: TSLA) options are now pricing in an expected move for this week of about 9% and more than 15% for the month of March. We last detailed Tesla and how spreads could lessen costs while defining risk when the stock was near $800. (you can read more about that here). […]