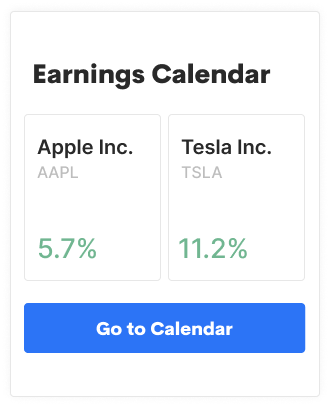
The Broader Markets
Last week saw short squeezes in a handful of names, selling pressure in the major indices and a huge spike in options volatility across the board.
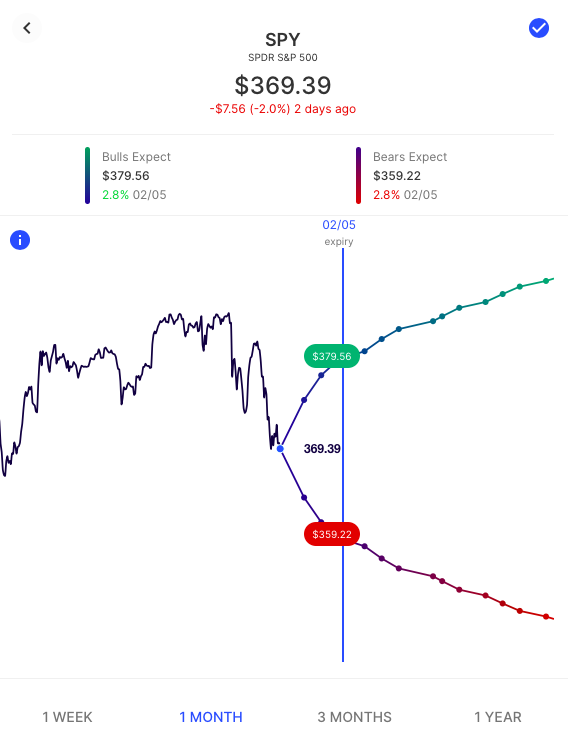
With the VIX now above 30, SPY options are pricing a nearly 3% move by Friday. That’s more than double what options were pricing at the beginning of last week. You can see what that corresponds to for a bullish/bearish consensus here:
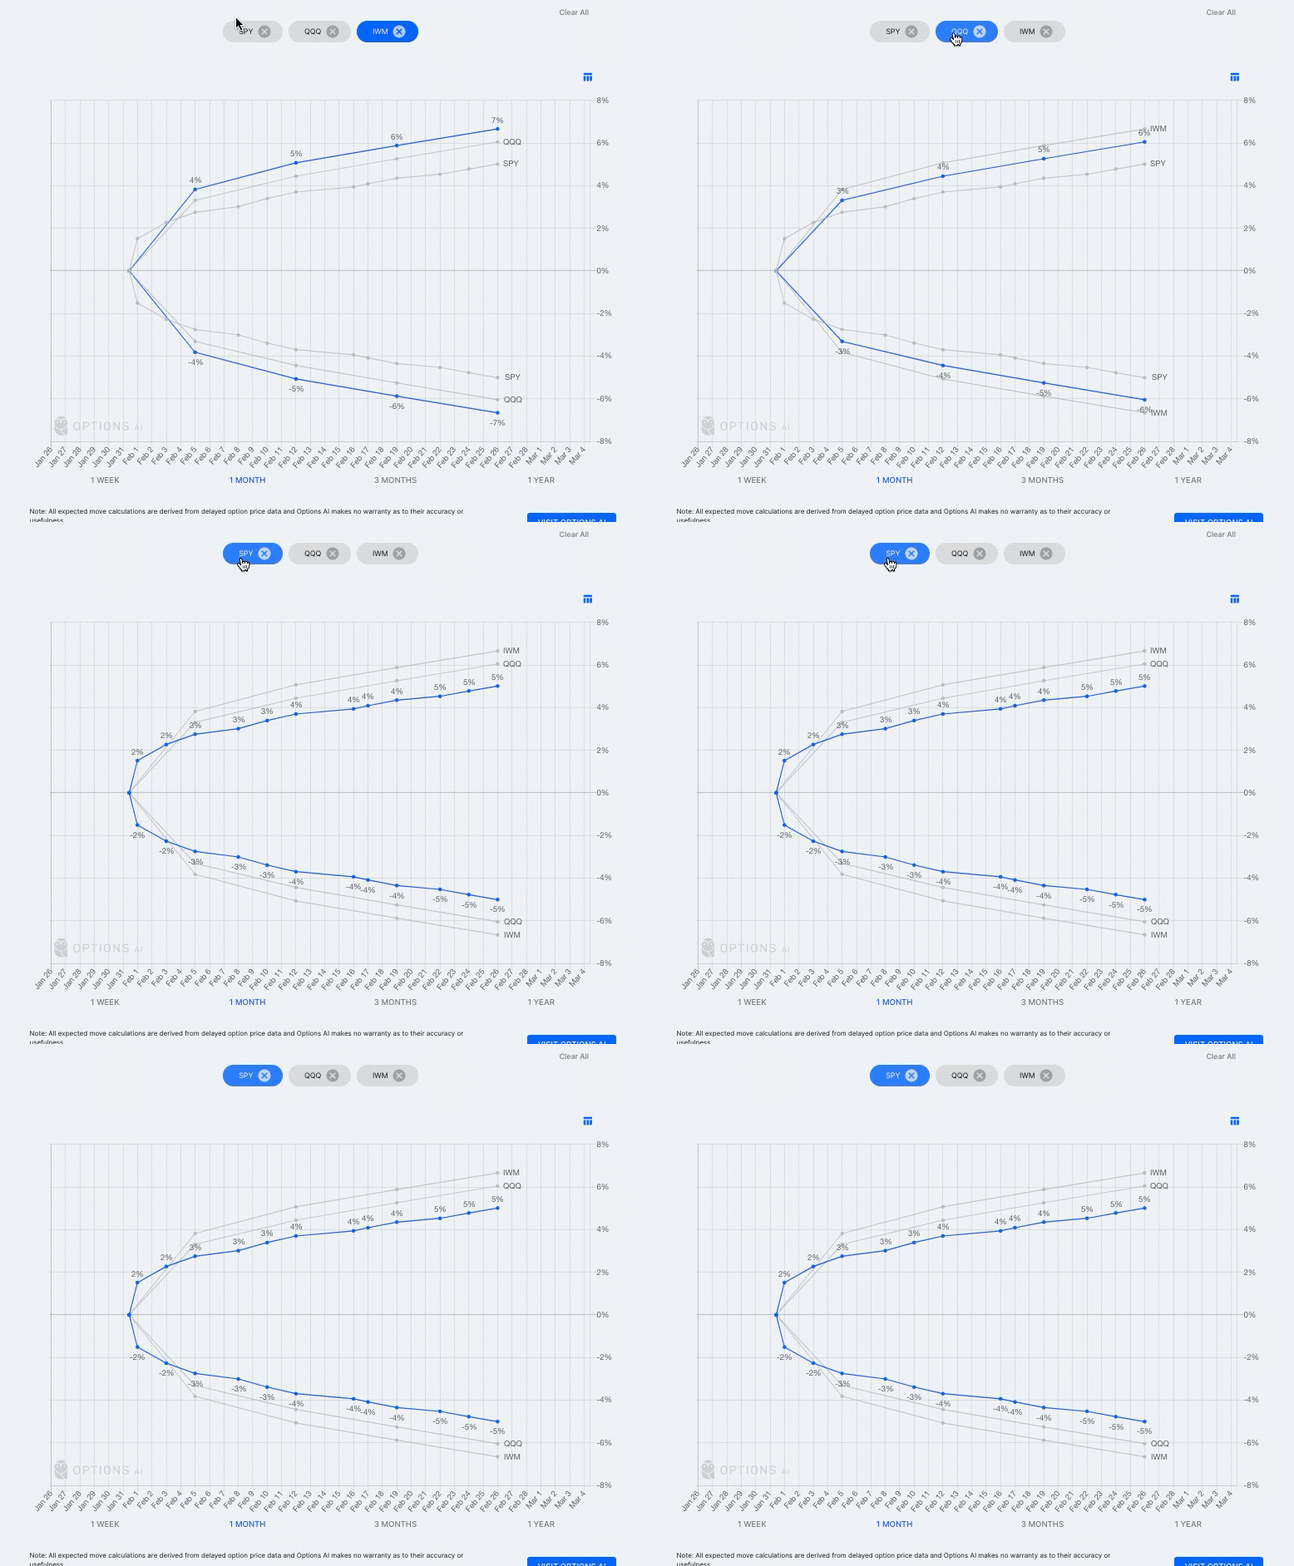
Using the Options AI Expected Move Calculator for the full month we can compare SPY, QQQ, and IWM, with the largest expected move in IWM:
In the News
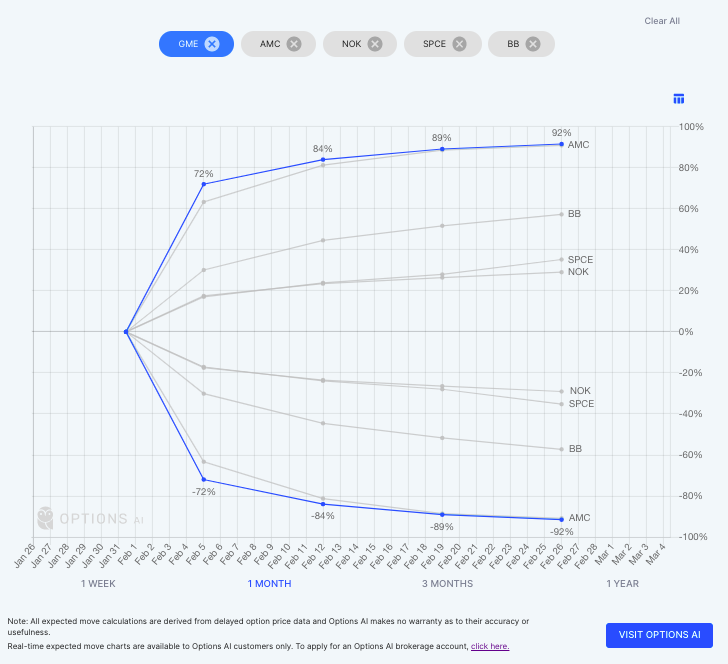
Obviously the meme/short squeeze stocks are garnering the most attention even as we see earnings from some of the biggest companies in the world. Prior coverage of the Short Squeeze, with emphasis on the options market component can be found here. Here’s a comparison of expected moves for the next month in a handful of the meme stocks, Gamestop, AMC, Nokia, Virgin Galactic and Blackberry via the Options AI calculator. GME and AMC both check in above 90% as a move in either direction according to options pricing (link):
Expected Moves for Companies Reporting Earnings
This week, Alphabet and Amazon headline a huge calendar of earnings reports that also include Alibaba, Spotify, Snap, Exxon Mobile, Chipotle and many, many more. We’ll highlight a few below with expected moves by Friday, but you can find a larger searchable list with expected moves and recent history on the Options AI Earnings Calendar.
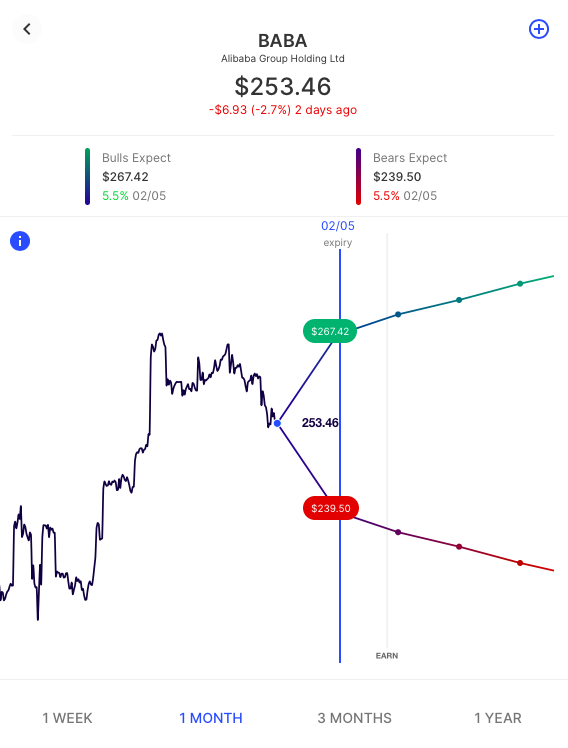
Alibaba / Reporting Tuesday before the open / 5.5% Expected Move / link
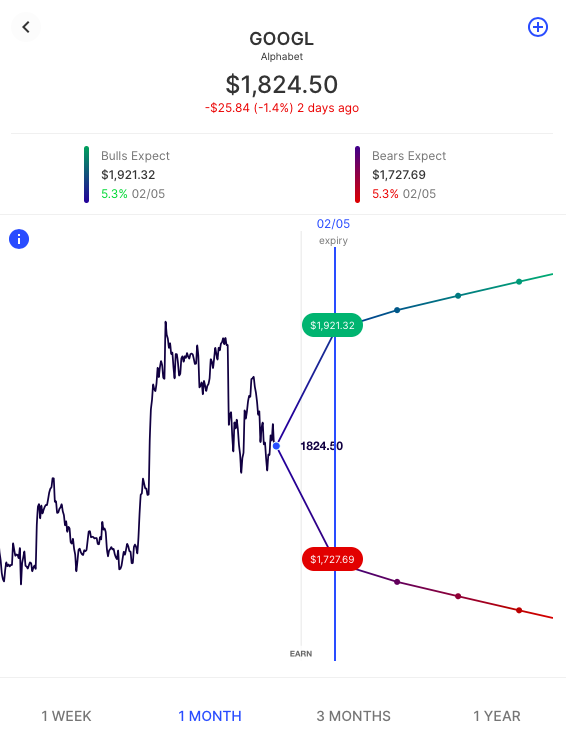
Alphabet / Reporting Tuesday after hours / 5.3% Expected Move / link
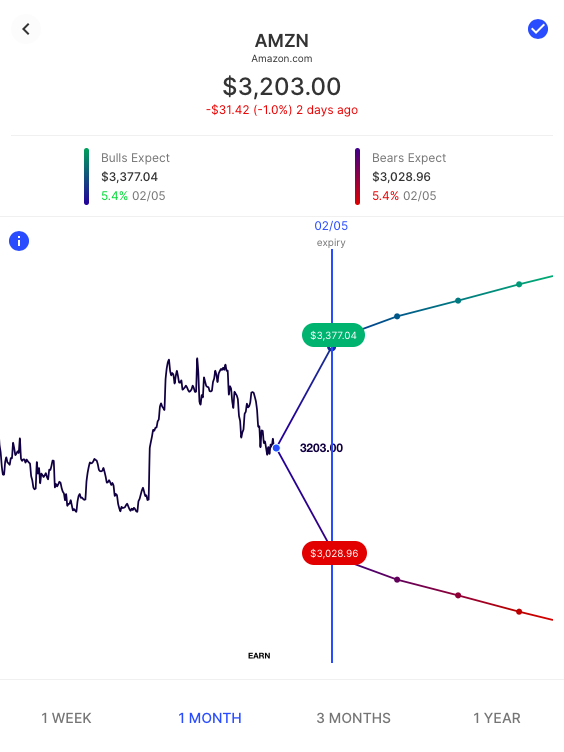
Amazon / Reporting Tuesday after hours / 5.4% Expected Move / link
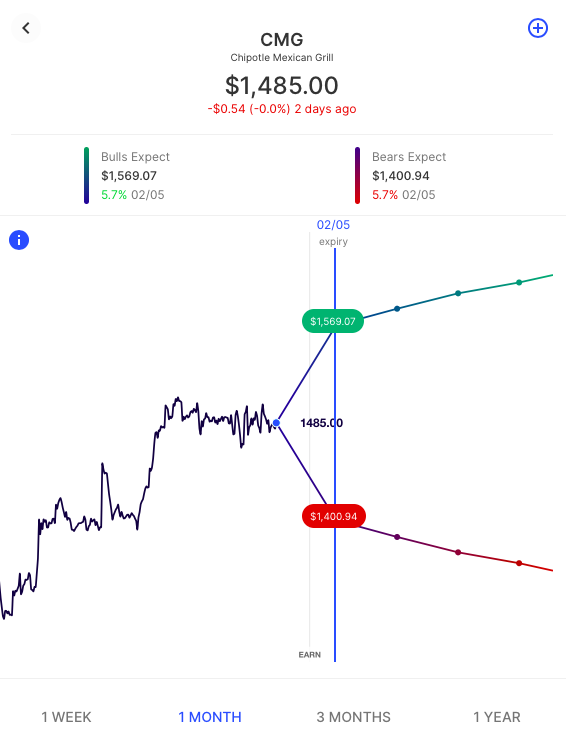
Chipotle / Reporting Tuesday after hours / 5.7% Expected Move / link
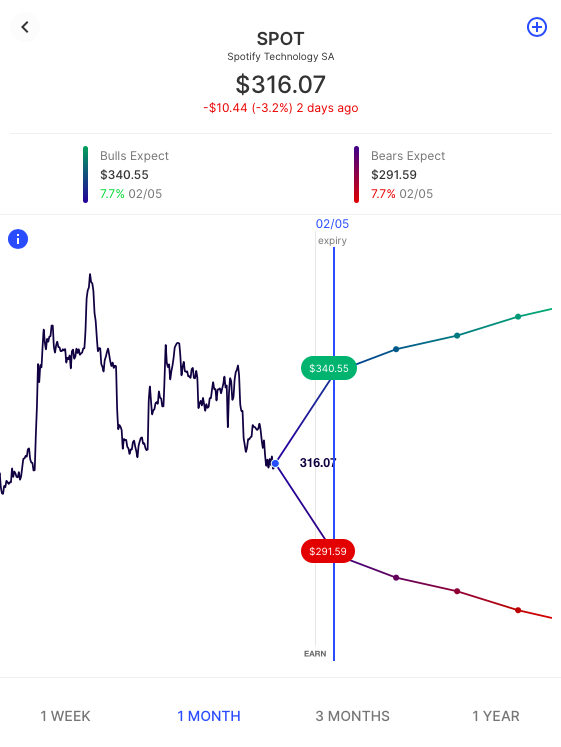
Spotify / Reporting Wednesday before the open / 7.7% Expected Move / link
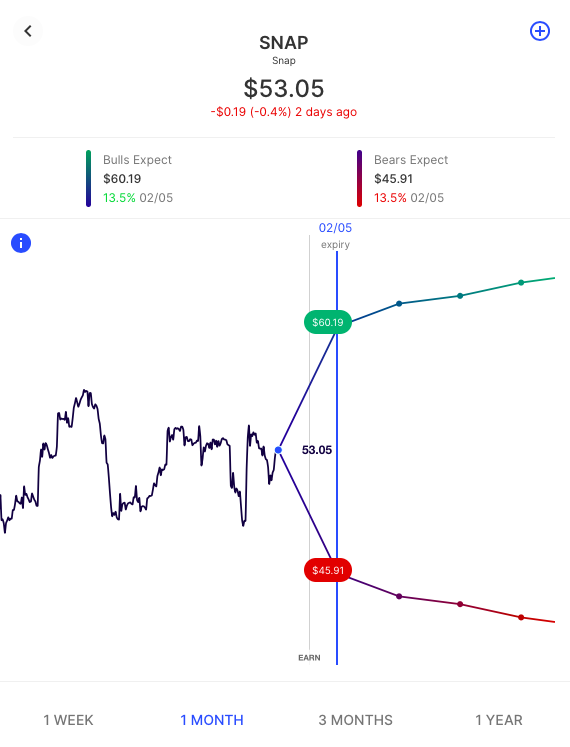
Snap / Reporting Thursday after hours / 13.5% Expected Move / link
Using the Expected Move to Help Inform Spread Trading
The expected move is the amount that options traders believe a stock price will move up or down. It can serve as a quick way to cut through the noise and see where real-money option traders are pricing potential stock moves. On Options AI, it is calculated using real-time option prices and displayed on a chart.
Knowing this consensus before making a trade can be incredibly powerful, regardless of whether you’re using stock or options to make your trade. A helping hand with setting more informed price targets as well as a useful basis for starting strike selection.
Here’s an example, using SNAP and its expected move. On the Options AI platform, a trader can select the bullish or bearish consensus to generate debit and credit spreads based on the move. Or, if a trader believes that the options market is overestimating the move, a trader can select a neutral view to sell to both the bulls and the bears and generate credit/income generating strategies such as an Iron Condor at the expected move – shown here:
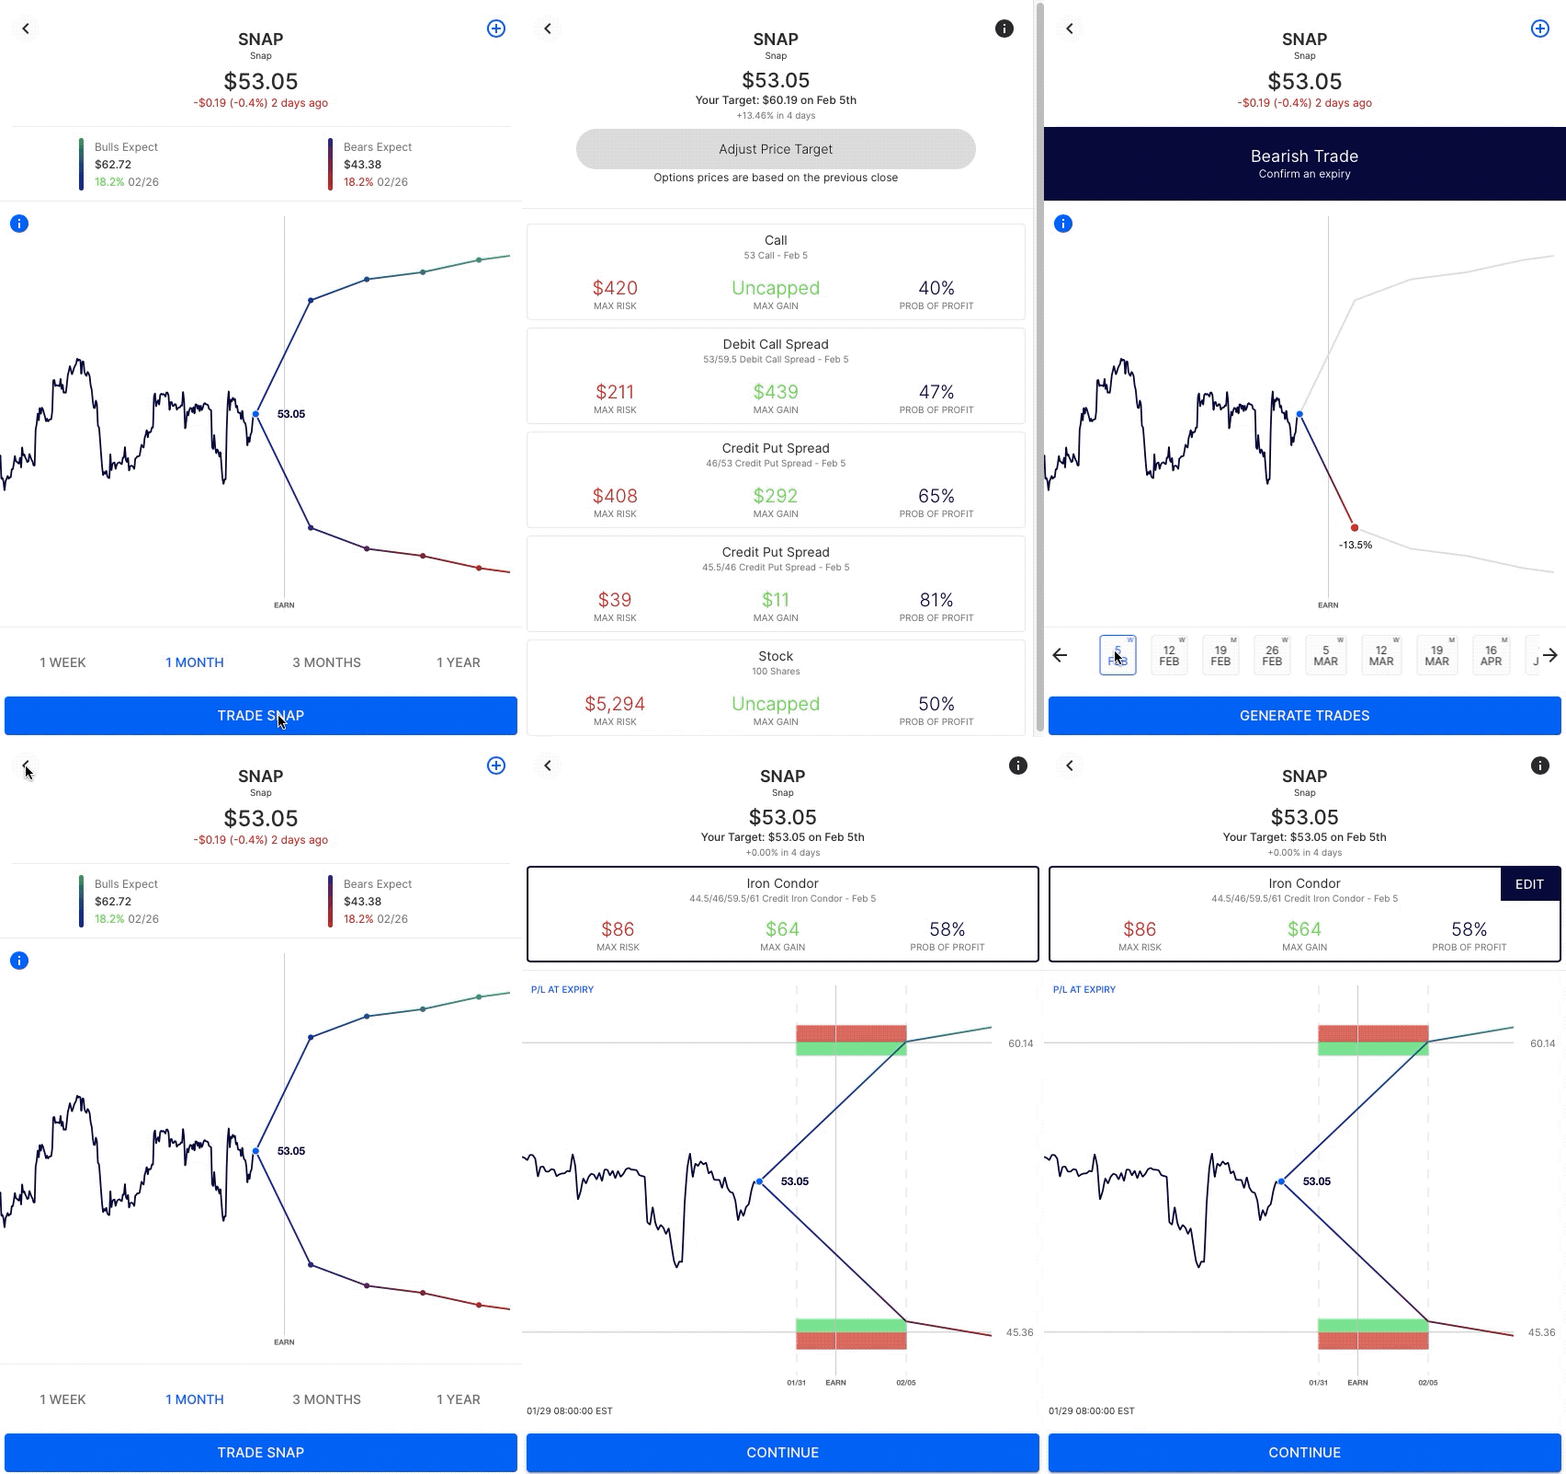
Or a trader can select their own price target, and still use spreads to limit overall cost, particularly when their belief is that traders have underpriced the expected move. In any strategy the expected move is useful as a baseline for potential strike selection.
Summary
The Options AI expected move chart helps traders visualize just how much volatility option traders are pricing into stocks like SNAP or GOOGL, and in what timeframe.
Options AI puts the expected move at the heart of its chart-based platform and Learn / Options AI has a couple of free tools as well as education on expected moves and spread trading. The concepts can apply to any stock and SNAP is simply used here as for illustrative purposes.

