Just a few trading days after the stock’s direct listing, Coinbase options have also begun trading. Below we’ll look at how traders are pricing potential movement, and how options can be used.
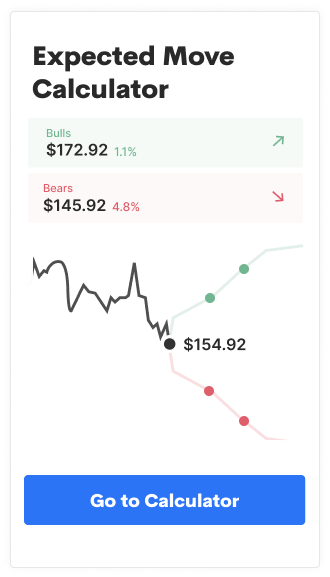
The Expected Move
How a new listing like COIN will behave in early trading is unknown, but we can look to the options market to uncover how traders are positioning themselves. With the Options AI chart we can visualize the expected move (from option implied volatility) to get a sense of the magnitude of move, up or down, that traders are expecting over time.
At the time of writing, we see that options are pricing about a 12% move for the stock (in either direction) by May 21st. With COIN trading near $311, the move corresponds to about $348 for a bullish consensus, and $274 for bearish.
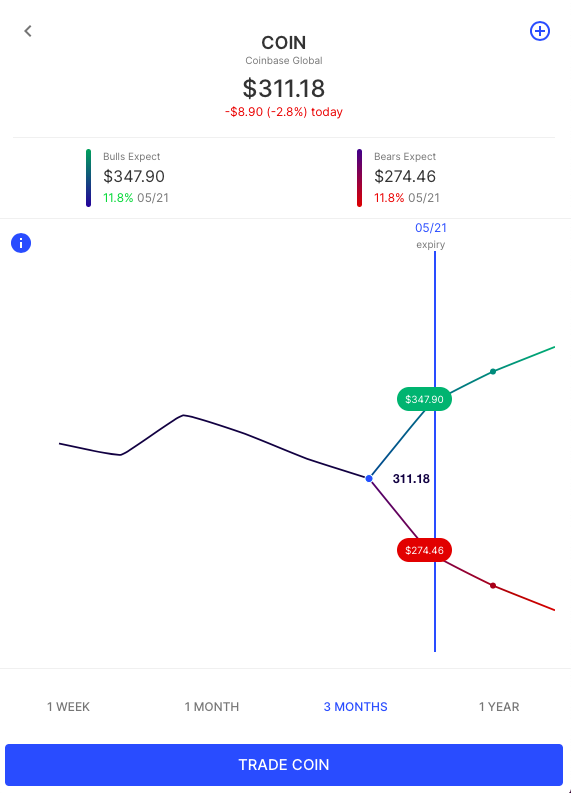
The expected move by the end of June is about 20% and by the end of 2021, more than 35%. In its brief existence, the stock has had a range of about 30% between its all time highs ($429, its first day of trading) to its recent lows ($302).
Bullish Alternatives
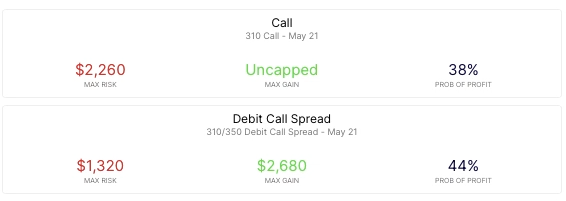
The at-the-money $310 call (expiring May 21st) currently costs about $23. That call would need COIN to be above $333 on May 21st to be profitable.
Using Options AI we can compare the at-the-money Call above to alternative strategies like debit and credit spreads that, in this case, use the expected move to guide strike selection for the spread.
Here’s an example, with a bullish price target in line with the May expected move. Note the risk, reward and probability (of break-even) on the trade comparison, and the stock break-evens (in grey) on the trade charts:
Debit Call Spread (bullish) – For instance, the 310/350 debit call spread costs about $13. It buys an at-the-money call (the 310), while simultaneously selling a call (the 350) near the expected move in the stock ($348). At a cost of around $13, it is therefore profitable with the stock above $323 at May expiration.
That’s clearly closer to where the stock is trading currently than the $333 break-even level when just buying the $310 Call. That difference in breakeven price is reflected in the probability of profit below:
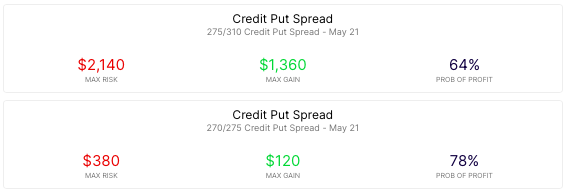
Credit Put Spreads (bullish) – Another way to express a bullish view is via Credit Put Spreads. A trade that might be viewed as ‘selling to the bears’. In the example below the COIN May21 275/310 Credit Put Spread can been seen to effectively mirror the Debit Call Spread by selling at at-the-money Put and simultaneously buying a Put around the bearish consensus expected move level. In being short an at-the-money Put and having received premium upfront, the breakeven level of the trade at expiry can be below where the stock is currently trading. In turn, this can help push probability of profit above 50%. Of course, with options there are always trade-offs. When it comes to Credit Spreads, one of the trade-offs for enjoying higher probabilities is that more must be risked in relation to maximum potential reward:
Bearish Alternatives
The at-the-money $310 Put (expiring May 21st) costs about $23. That Put would need COIN below $292 on May 21st to be profitable.
Using Options AI we can compare the at-the-money put to alternative strategies like put spreads and credit call spreads, once again using the expected move:
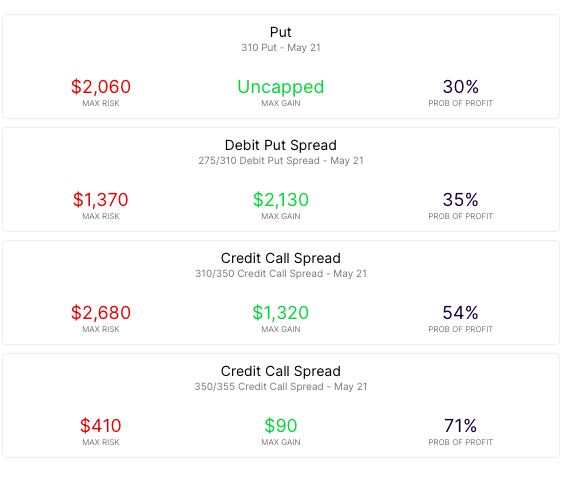
You may notice here that bearish Credit Call Spreads risk more to make less in comparison to bullish Credit Put Spreads in the Bullish section. Despite both strategies having strikes that map to the expected move and the same width. That is a result of options skew. The skew in this case is a result of demand for upside calls in COIN. Those upside calls are trading at a slightly higher implied volatility than at-the-money calls. When buying a debit call spread, the trader is taking advantage of skew, buying a call at a lower volatility than the call they simultaneously sell. Selling bearish credit call spreads are somewhat negatively affected by that skew, selling a call at a slightly lower volatility than they call being bought.
Options AI provides a couple of free tools like an expected move calculator, as well as an earnings calendar with expected moves. More education on expected moves and spread trading can be found at Learn / Options AI.
Based upon publicly available information derived from option prices at the time of publishing. Intended for informational and educational purposes only and is not any form of recommendation of a particular security, strategy or to open a brokerage account. Options price data and past performance data should not be construed as being indicative of future results and do not guarantee future results or returns. Options involve risk, including exposing investors to potentially significant losses and are therefore not suitable for all investors. Option spreads involve additional risks that should be fully understood prior to investing. Securities trading is offered through Options AI Financial, LLC a registered broker-dealer.