Compare your trade breakevens to understand the difference between single options, multi-leg and credit vs debit trades at your disposal.
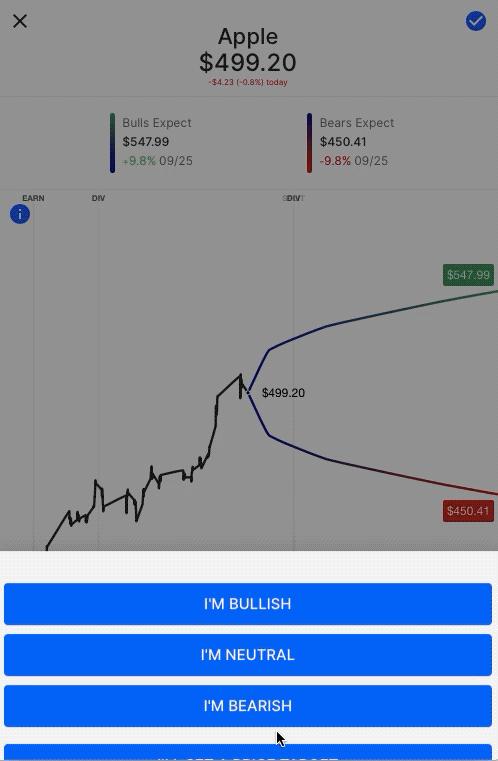
When selecting a trade pay close attention to the trade breakevens, in relation to each other and consensus. Here are some examples with a bullish price target, using the “I’m bullish” fast trade button:
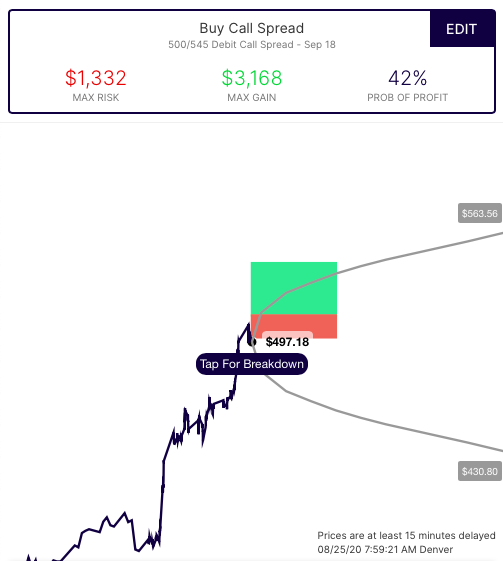
Call versus Call Spread
With a bullish price target to consensus we see 3 options trades, long call, long call spread, and short put spread. First, let’s compare the long call and long call spread, side by side:
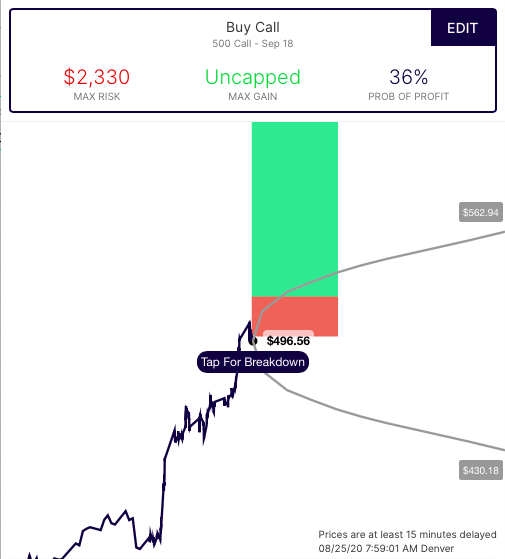
What’s immediately apparent is the difference in cost of the two trades. The difference in cost, like everything in options is because of tradeoffs. The call has unlimited profit potential, but it sacrifices for that potential by having a higher cost, and a higher breakeven level from the current stock price (and therefore has a lower probability of profit).
The call spread is less expensive, and has a breakeven closer to the current stock price (and therefore a higher probability), but it sacrifices by having its upside potential capped.
The bullish consensus for September in Apple is around $545. The debit call spread uses that to sell any move above that area, lower its cost and establish a lower breakeven of around $513 in the stock, versus $523 in the call.
Credit (Bullish) Put Spread
Next, let’s look at the third trade, the bullish credit put spread:
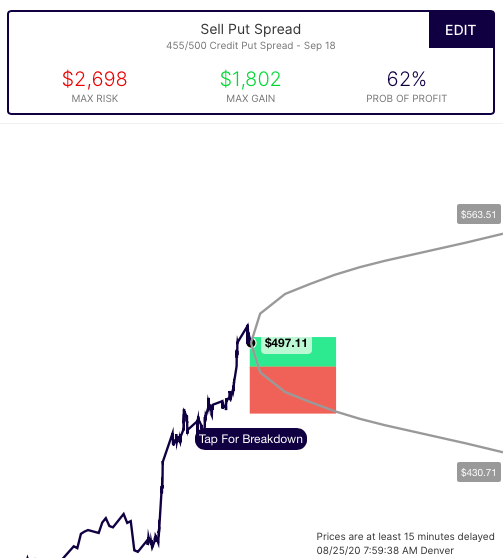
The first thing to notice is the inverted risk reward. It risks more, to make less. That’s its main sacrifice. But with that tradeoff comes a much lower breakeven (lower than where the stock is trading) and much higher probability of profit than either buying a call, or buying a call spread. This trade is a profitable anywhere above $482 on expiration (with the stock currently $499) and has a max gain if the stock is above $500. It defines the risk of selling the 500p by buying the 455p at the bearish expected move.
Summary
What we see here is 3 different ways to express a bullish view, each with tradeoffs. Those tradeoffs are easily understandable if we compare the risk/reward, and the probability of profit, based on the breakeven level established in the stock:
Long Call
Risk: $23.30
Reward: unlimited
Breakeven: $523.30
Probability: 36%
Long Call Spread
Risk: $13.32
Reward: $31.68
Breakeven: $513.32
Probability: 42%
Short Put Spread
Risk: $26.98
Reward: $18.02
Breakeven: $481.98
Probability: 62%
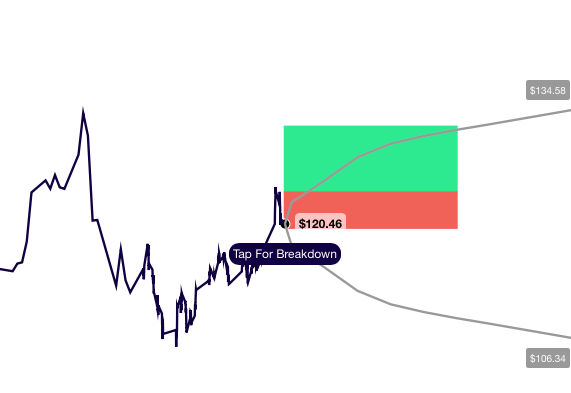
The risk-reward and probability of each trade can be found on the trade comparison, as well as each trade’s payout diagram. Within the payout diagram, you can click “Tap for Breakdown” to see the exact breakeven (live pricing) as well as the max gain and max loss levels.


Add comment