Options AI has released the latest version of its options trading platform. There are a couple of notable enhancements that aim to make trading and trade management more intuitive. Let’s dive into a few here.
New Charts
Overall the new charts are more detailed. You can now see the bullish and bearish consensus levels at each expiry on hover. The historical side of the chart is more detailed with more time intervals. These enhancements make for easier technical level comparisons.
Here’s how all that looks in practice:
Better Fast Trade Flow
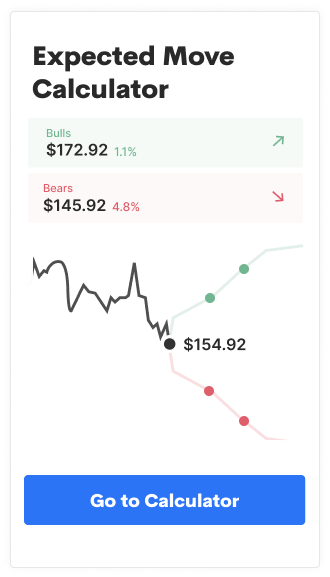
Trades based on the expected move (the “I’m Bullish”, “I’m Bearish” or “I’m Neutral” buttons) now show the percentage move for the selected expiry. Here’s an example with a Bearish price target:
Before progressing to trades based on expected moves, the trader can get a sense of those percentage moves by expiry and directly compare those moves to historical stock levels.
Dynamic Profit/Loss on Trade Diagrams
The breakeven of the trade is now labeled on the chart. A hover on the chart will reveal the net profit or loss (at expiration) of the trade at any stock level:
This helps provide a deeper understanding of each trade type. It’s also useful for comparing potential moves in the stock against the historical chart. For instance, what a trade would be worth at historical support or resistance.
Dynamic Profit/Loss on Position Page
The same hover effect is also on the position page and can help with trade management. For example, the current profit in this trade can be compared directly to what the trade’s final profit or loss would be at expiration, both where the stock is now, or if it moved higher or lower:
We think this is a more intuitive way to understand the effect of time, short/long premium, and delta on a position. Combined with the updating metrics below the chart, the position page is intended to help with trade management decisions, particularly when to exit a trade.