
Market View
Last Week – Closing with a VIX Level we haven’t seen in years
SPY finished higher by about 0.8% last week, another fairly quiet move inside what options were pricing (+/- 1.6%). The VIX was lower on the week and its closing low Friday near 17 is its lowest level since the late 2021all time market highs. The range on the week was also inside the expected move, with less than a 1.5% difference between the intra-week highs and lows. In other words, IV is low, but realized moves for the past few weeks have been even less.
This Week – Earnings heat up as IV cools
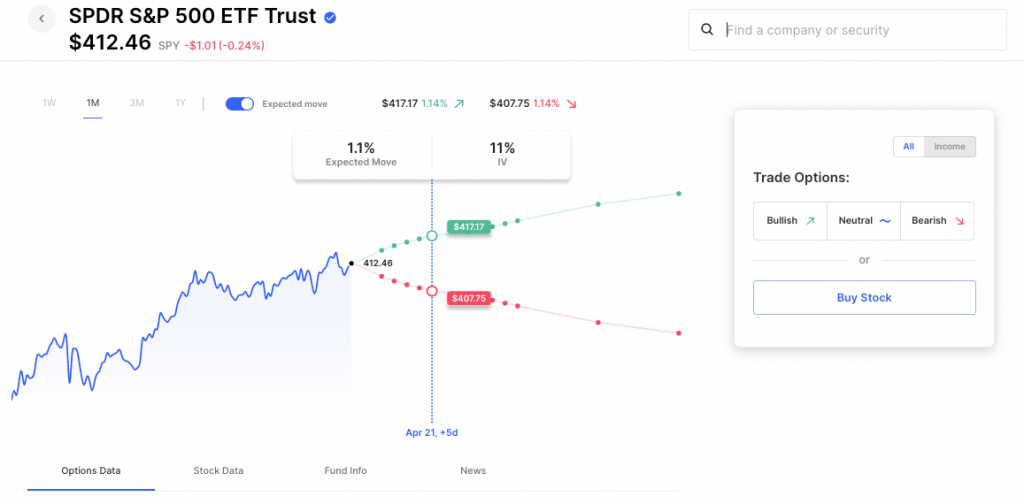
SPY options are pricing just a 1.1% move for the upcoming week. That’s as low a move as we’ve seen in quite some time, a factor traders need to be aware of into what could be some idiosyncratic moves in individual stocks as they begin to report. A good example came Friday as several of the large banks reported. The banking system has obviously been a focus for traders the past month, and banks giving insight in that environment would typically come in high vol environment. But because the market had stabilized since the regional bank chaos, the big banks that reported on Friday actually reported in a low IV environment. The result was two of the banks, PNC and Wells Fargo barely moving, well inside their expected moves, while the two that did see moves (JPM and Citi) nearly doubled their expected moves to the upside.
A general rule of thumb on expected moves into earnings is that a stock will stay at or inside its expected move roughly 70% of the time. But the IV backdrop does factor into those numbers. When IV is historically high, it is more likely that a stock stays within its expected move, with the moves outside expectations sometimes massive, but occurring less often. However, when the IV backdrop is low, moves outside expectations tend to happen more often, but the outsized moves themselves tend to be less massive. This makes sense intuitively. Had JPM reported in the middle of the banking turmoil of last month, and shown a net inflow of deposits from regional banks, while its IV, and the market’s overall IV had been alot higher, its move may have been even more. And that’s not just due to sentiment, although that’s a big factor, but it also has to do with the amount of short gamma that is in the market at high IV levels. High IV can create air pockets for stocks to move through. Whereas lower IV backdrops can create a long gamma backdrop, acting as a governor on moves.
The TL:DR version of that is that moves in low-vol environments are smaller overall, with less short gamma in the market. But because the expected move is so much smaller as well, moves outside expectations happen more often. The 4 banks that reported Friday are a small sample size, but the fact that two barely moved, and the other two doubled their expected move on a move that would have been considered normal just a few weeks ago, is a good illustration.
So what does that mean for trade strategies? Credit spreads create really tight windows for a stock to stay within, and it will often be self-fulfilling. The fact that the SPY’s last two weeks saw moves of just 0.4% and 0.8% is indicative of that. However, when a stock does violate that expected move, it won’t take much, and is likely to happen slightly more often. Credit Spreads should be defined risk because the premium received is not enough to make up for the fact that a % move of a couple percent could be a 4x loss. And debit spreads could look to take advantage of that as well. For instance, the likelihood of a massive move on earnings of 20% in a low IV/long gamma environment of a stock expecting a 5% move is very unlikely, however, that stock moving 6-7%, slightly beyond the expected move will happen more often. And because of that, a debit spread at the expected move could see a 3-4x return when that stock goes beyond expectations.
E.G., a stock trading $100 with a 5% expected move, the trader looking to sell premium should be very careful to define risk narrowly, perhaps a dollar wide at or beyond the expected move, so that a move to $92 or $108 (beyond the tight $95 to $105 expected move) doesn’t cause outsized losses. And on the flipside, there can be an opportunity for a long premium trader looking for a move beyond $95 or $105, with say a 105/106 call spread or a 95/94 put spread, rather than a lotto ticket call or put. The chances that the stock will make a massive move is less likely, but the chance it will move slightly beyond the move, is a slightly more frequent occurrence in low IV.
Note, although a 17 VIX is the lowest level for the past few years, it isn’t super low historically and could just be a blip before it goes higher, or it could go much lower (mid to low teens is historically low). However, it is now lower than the historical mean, something we haven’t seen much of in recent years.
Expected Moves for This Week (via Options AI)
- SPY 1.1%
- QQQ 1.6%
- IWM 1.7%
- DIA 1.1%
Economic Calendar
- Tuesday – Housing starts, Fed Speech (Bowman)
- Thursday – Initial jobless claims, Philly Manufacturing
Unusual Option Volume Thursday
- BA, HON, NVDA, BUD, META, NFLX, SCHW
Earnings This Week
Via the Options AI Earnings Calendar (free to use) showing expected moves as currently priced and past moves for comparison.
Monday
- Charles Schwab SCHW – Expected Move: 8% [Prior] -3% -2% -2
Tuesday
- Bank of America BAC – Expected Move: 4.3% [Prior] +2% +6% 0%
- Goldman Sachs GS – Expected Move: 3.4% [Prior] -6% +2% +3%
- Lockheed Martin LMT – Expected Move: 2.4% [Prior] +2% +9% +1 -2%
- Netflix NFLX – Expected Move: 7.4% [Prior] +8% +13% +7% -35%
- United Airlines UAL – Expected Move: 5.2% [Prior] -1% +5% +1% +1%
Wednesday
- Morgan Stanley MS – Expected Move: 3.6% [Prior] +6% -5% 0%
- ASML Holding ASML – Expected Move: 3.7% [Prior] +2% +6% +3% +3%
- Tesla TSLA – Expected Move: 7% [Prior] +11% -7% +10% +3%
- IBM IBM – Expected Move: 3.7% [Prior] -5% +5% -5% +7%
Thursday
- Taiwan Semi TSM – Expected Move: 4.3% [Prior] +6% +4% +3%
- American Express AXP – Expected Move: 3.7% [Prior] +10% -2% +2% -3%
Based upon publicly available information derived from option prices at the time of publishing. Intended for informational and educational purposes only and is not any form of recommendation of a particular security, strategy or to open a brokerage account. Options price data and past performance data should not be construed as being indicative of future results and do not guarantee future results or returns. Options involve risk, including exposing investors to potentially significant losses and are therefore not suitable for all investors. Option spreads involve additional risks that should be fully understood prior to investing. Securities trading is offered through Options AI Financial, LLC, member FINRA and SIPC.