
Good morning!
Amazon popped higher initially on its earnings after the close giving hopes that yesterday’s rally could carry over into today. But the stock reversed overnight and is now lower by more than 2%. With that, the futures are down slightly, a bit of a pullback from the strong close yesterday. Exxon Mobile reported this morning and is slightly higher. Chevron is slightly lower.
On the economic front, the PCE was just reported and was in line (to a tick hot.) The PCE is a key inflation metric for the Fed and like most inflation metrics is sort of sticky right now. As we’ve seen during earnings season so far, those higher prices are helping a lot of consumer companies beat expectations, despite sluggish product growth.
Pre-Market Movers:
- First Republic Bank (FRC) +6.95%
- Amazon.com Inc (AMZN) -2.82%
- Snap Inc (SNAP) -18.76%
- Nokia Corp ADR (NOK) -0.96%
- Intel Corp (INTC) +5.66%
- Tesla Inc (TSLA) -0.56%
- AT&T Inc (T) -0.28%
- Microsoft Corp (MSFT) -0.20%
- Pinterest Inc (PINS) -13.05%
- Meta Platforms Inc (META) +0.27%
- Apple Inc (AAPL) -0.45%
- Nvidia Corp (NVDA) +0.41%
- Marathon Digital Hldgs Inc (MARA) -1.69%
- Carnival Corp (CCL) -0.79%
- Sofi Technologies Inc (SOFI) +1.65%
- Alcoa Corp (AA) +0.72%
- Adv Micro Devices (AMD) +0.32%
- Exxon Mobil Corp (XOM) -0.11%
- American Airlines Gp (AAL) +0.16%
- Alphabet Cl A (GOOGL) -0.60%
Today’s Earnings Highlights:
- Exxon Mobil Corporation (XOM) Expected Move: 2.12%
- Chevron Corporation (CVX) Expected Move: 2.24%
Full list here: Options AI Earnings Calendar.
Economic Calendar:
- At 10:00 AM (EST) Michigan Consumer Sentiment (Apr) Estimates: 63.5%, Prior: 62%
- At 09:45 AM (EST) Chicago PMI (Apr) Estimates: 43.5%, Prior: 43.8%
- At 08:30 AM (EST) PCE Price Index MoM (Mar) Estimates: 0.3%, Prior: 0.3%
- At 08:30 AM (EST) Core PCE Price Index MoM (Mar) Estimates: 0.3%, Prior: 0.3%
Options AI Scanner Highlights:
Based on the prior day’s trading action.
Full lists here: Options AI Free Tools.
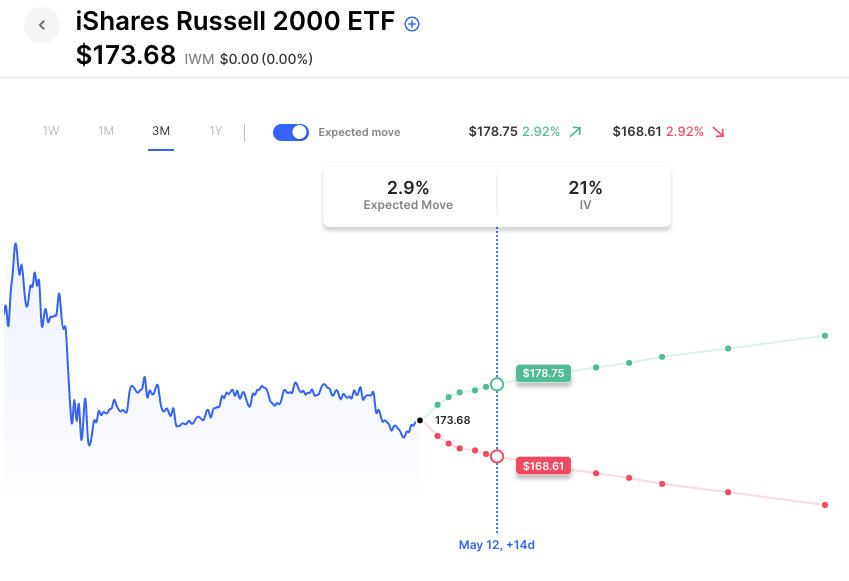
Chart of the Day:
IWM has been in about a 5% range since its Feb selloff. It’s currently about 3% from that range’s highs and 2% off its lows:
That’s all for now. Have a great day!
The Options AI Team
Based upon publicly available information derived from option prices at the time of publishing. Intended for informational and educational purposes only and is not any form of recommendation of a particular security, strategy or to open a brokerage account. Options price data and past performance data should not be construed as being indicative of future results and do not guarantee future results or returns. Options involve risk, including exposing investors to potentially significant losses and are therefore not suitable for all investors. Option spreads involve additional risks that should be fully understood prior to investing. Securities trading is offered through Options AI Financial, LLC, member FINRA and SIPC.