
Gamestop shares have soared the past few days with the stock up nearly 200% at one point from last week (but still down significantly from recent short squeeze highs). We’ll look at the unique situations that arise in the options of a highly volatile stock like Gamestop and a few things that might be considered before trading options.
Gamestop: The Expected Move
First, a look at how options are pricing upcoming moves. Here’s the Options AI expected move chart for Gamestop, with a nearly 30% move being priced into this Friday’s close. And a roughly 80% move being priced for the next month. A month that includes an earnings event (unconfirmed):
Gamestop: Call Spreads vs Outright Calls
Using March 19th as an expiry we first looks at bullish spreads, and compare directly to outright calls. With a stock as volatile as Gamestop, calls can be expensive. Because of that, many traders resort to buying far out of the money calls. That demand for upside calls increases volatility in those calls, making them expensive relative to at-the-money calls – a phenomenon known as skew. However, for those that are bullish, this may create an opportunity to utilize spreads rather than buying an outright call. Let’s see how.
Here we’ll focus on one alternative – using debit spreads to lower the overall cost of a directional trade (while potentially improving the probability of profit of the trade itself by lowering the breakeven level). It does so by selling those relatively expensive out-the-money Calls to help finance the purchase of a nearer to at-the-money Call.
With Gamestop near $105, the March 19th 110/190 Debit Call Spread is roughly $15 and targets the bullish expected move for March 19th. The debit call spread would need the stock to be above $125 on March 19th to be profitable.
As a comparison, the GME March 19th 200 calls are trading $29. That’s nearly twice the cost for a 200 call that needs the stock above $229 by March 19th… versus a call spread, that needs the stock above $125. Here’s a side by side comparison of those two trades on the Options AI chart. First, the 200 call:
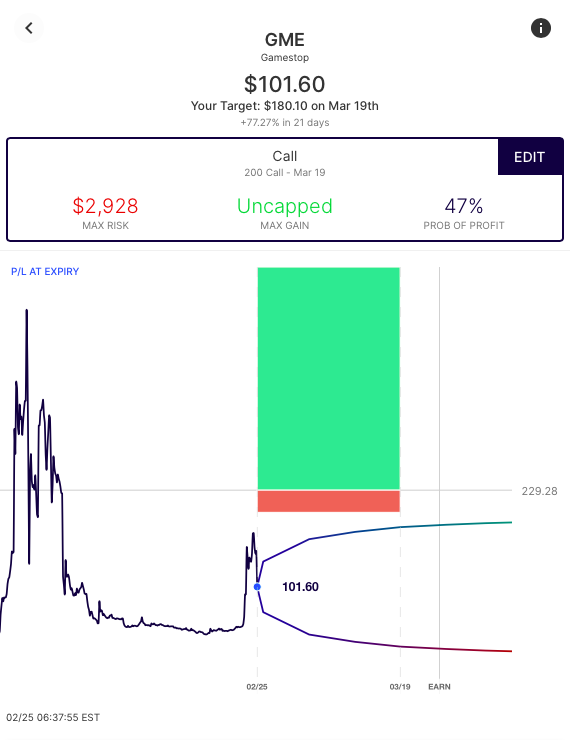
And next, the 110/190 debit call spread:
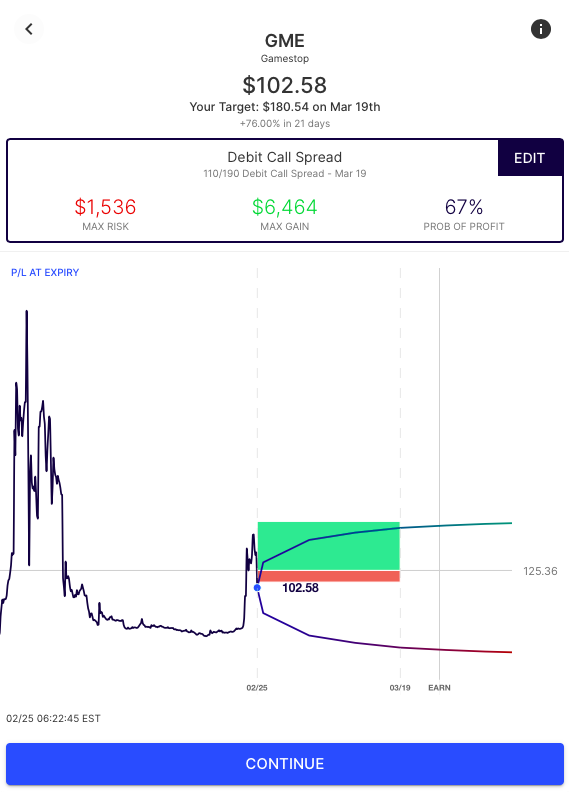
As you can see, not only is the call spread less expensive, the point at which is becomes profitable to the upside is much closer to where the stock is currently trading. (As indicated by the grey price of the breakeven.)
A note on probability of profit. The probability of profit displayed on these trades is based on the delta being assigned to the breakeven of the trade. The fact that a 200 call in a $105 stock is trading near 50 deltas shows just how distorting an effect Gamestop volatility is having on its options (hard to borrow, skew, retail demand for out-of-the-money calls).
Directional Butterflies vs Outright Puts
High volatility also affects bearish options trades. One of the counter-intuitive aspects of a high volatility stock like Gamestop is that its implied volatility can go up as the stock goes higher and down as the stock goes lower. This is the opposite of how we generally think about volatility. Therefore, buying outright puts carries a risk of collapsing volatility (and therefore collapsing premiums) as the stock goes lower. So, even though the stock is moving in the intended direction, as an option holder you may not be realizing the gains expected.
One way to counter high implied volatility in a stock, especially when having a bearish view, is to be a net seller of option premium. To sell to bullish option traders rather than join bearish option traders. Traditionally that might take the form of selling a Credit Call Spread. But in GME’s case that means buying the (expensive) upper strike Call at a higher volatility than the Call that is closer to the money (as described above).
So, one option strategy that can be considered by traders is using a Butterfly. An option trade that is more typically associated with a neutral trading view, but here adapted to actually create a targeted (bearish) directional view.
Here, as an example, is a Butterfly with its center strikes focused at $80 in the stock, with a March 19th expiry:
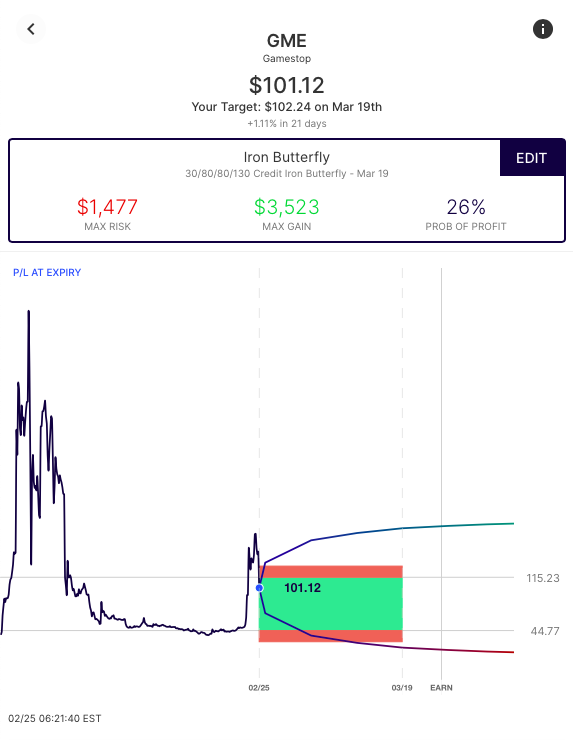
This 130/80/30 butterfly has breakevens of 115 and 45, meaning the trade is profitable if the stock is between those two prices at March 19th expiry… with a max gain occurring if the stock is at or near $80. It has the additional dynamic of being short premium, and if the stock stays within its range would see mark to market gains if implied volatility compressed.
Note
Please note, any stocks and/or trading strategies referenced are for informational and educational purposes only and should in no way be construed as recommendations. The strategies depicted represent just a few of the many potential ways that options might be used to express any particular view. All prices are approximate at the time of writing. Option spreads involve additional risks that should be fully understood prior to investing.
Learn / Options AI has a couple of free tools, including an earnings calendar with expected moves, as well as education on expected moves and spread trading.


[…] This is not quite as dramatic as a meme stock like Gamestop where a trader would need to go really far out of the money to find a call trading at the same price as a call spread. Read here for the specifics on GME and other high volatility stocks. […]
[…] Beyond the weakness in the broader markets, former short squeeze/meme stocks like Gamestop (NYSE: GME) were back in the news. Here’s Gamestop’s (GME) expected move for this week (nearly 50%) and over the next month (75%). Last week detailed the uniqueness of options pricing in high volatility stocks like Gamestop and how that could help inform trade types for directional views (you can read more about that here). […]
[…] This is not quite as dramatic as a meme stock like Gamestop where a trader would need to go really far out of the money to find a call trading at the same price as a call spread. Read here for the specifics on GME and other high volatility stocks. […]
[…] This is not quite as dramatic as a meme stock like Gamestop where a trader would need to go really far out of the money to find a call trading at the same price as a call spread. Read here for the specifics on GME and other high volatility stocks. […]
[…] This is not quite as dramatic as a meme stock like Gamestop where a trader would need to go really far out of the money to find a call trading at the same price as a call spread. Read here for the specifics on GME and other high volatility stocks. […]
[…] This is not quite as dramatic as a meme stock like Gamestop where a trader would need to go really far out of the money to find a call trading at the same price as a call spread. Read here for the specifics on GME and other high volatility stocks. […]
[…] This is not quite as dramatic as a meme stock like Gamestop where a trader would need to go really far out of the money to find a call trading at the same price as a call spread. Read here for the specifics on GME and other high volatility stocks. […]
[…] This is not quite as dramatic as a meme stock like Gamestop where a trader would need to go really far out of the money to find a call trading at the same price as a call spread. Read here for the specifics on GME and other high volatility stocks. […]
[…] The difference in the implied volatility of the at the money call and the out of the money call is not quite as dramatic as a meme stock like Gamestop where a trader would need to go really far out of the money to find a call trading at the same price as a call spread but it it is still relevant. Read here for the specifics on GME and other high volatility stocks. […]
[…] The difference in the implied volatility of the at the money call and the out of the money call is not quite as dramatic as a meme stock like Gamestop where a trader would need to go really far out of the money to find a call trading at the same price as a call spread but it it is still relevant. Read here for the specifics on GME and other high volatility stocks. […]
[…] The difference in the implied volatility of the at the money call and the out of the money call is not quite as dramatic as a meme stock like Gamestop where a trader would need to go really far out of the money to find a call trading at the same price as a call spread but it it is still relevant. Read here for the specifics on GME and other high volatility stocks. […]
[…] The difference in the implied volatility of the at the money call and the out of the money call is not quite as dramatic as a meme stock like Gamestop where a trader would need to go really far out of the money to find a call trading at the same price as a call spread but it it is still relevant. Read here for the specifics on GME and other high volatility stocks. […]
[…] The difference in the implied volatility of the at the money call and the out of the money call is not quite as dramatic as a meme stock like Gamestop where a trader would need to go really far out of the money to find a call trading at the same price as a call spread but it it is still relevant. Read here for the specifics on GME and other high volatility stocks. […]
[…] The difference in the implied volatility of the at the money call and the out of the money call is not quite as dramatic as a meme stock like Gamestop where a trader would need to go really far out of the money to find a call trading at the same price as a call spread but it it is still relevant. Read here for the specifics on GME and other high volatility stocks. […]
[…] The difference in the implied volatility of the at the money call and the out of the money call is not quite as dramatic as a meme stock like Gamestop where a trader would need to go really far out of the money to find a call trading at the same price as a call spread but it it is still relevant. Read here for the specifics on GME and other high volatility stocks. […]
[…] The difference in the implied volatility of the at the money call and the out of the money call is not quite as dramatic as a meme stock like Gamestop where a trader would need to go really far out of the money to find a call trading at the same price as a call spread but it it is still relevant. Read here for the specifics on GME and other high volatility stocks. […]
[…] The difference in the implied volatility of the at the money call and the out of the money call is not quite as dramatic as a meme stock like Gamestop where a trader would need to go really far out of the money to find a call trading at the same price as a call spread but it it is still relevant. Read here for the specifics on GME and other high volatility stocks. […]
[…] The difference in the implied volatility of the at the money call and the out of the money call is not quite as dramatic as a meme stock like Gamestop where a trader would need to go really far out of the money to find a call trading at the same price as a call spread but it it is still relevant. Read here for the specifics on GME and other high volatility stocks. […]
[…] We recently wrote about the uniqueness of option implied volatility and skew in stocks that are experiencing large price movements like GameStop and (you can read that here). […]
[…] We recently wrote about the uniqueness of option implied volatility and skew in stocks that are experiencing large price movements like GameStop and (you can read that here). […]
[…] We recently wrote about the uniqueness of option implied volatility and skew in stocks that are experiencing large price movements like GameStop and (you can read that here). […]
[…] Options in high volatility stocks like GameStop are somewhat unique, with swings in implied volatility based on which direction the stock is going and skew between in-the-money and out-of-the-money options. We recently wrote about the uniqueness of option implied volatility and skew in stocks that are experiencing large price movements like GameStop (you can read that here). […]
[…] Options in high volatility stocks like GameStop are somewhat unique, with swings in implied volatility based on which direction the stock is going and skew between in-the-money and out-of-the-money options. We recently wrote about the uniqueness of option implied volatility and skew in stocks that are experiencing large price movements like GameStop (you can read that here). […]
[…] Options in high volatility stocks like GameStop are somewhat unique, with swings in implied volatility based on which direction the stock is going and skew between in-the-money and out-of-the-money options. We recently wrote about the uniqueness of option implied volatility and skew in stocks that are experiencing large price movements like GameStop (you can read that here). […]
[…] Options in high volatility stocks like GameStop are somewhat unique, with swings in implied volatility based on which direction the stock is going and skew between in-the-money and out-of-the-money options. We recently wrote about the uniqueness of option implied volatility and skew in stocks that are experiencing large price movements like GameStop (you can read that here). […]
[…] Options in high volatility stocks like GameStop are somewhat unique, with swings in implied volatility based on which direction the stock is going and skew between in-the-money and out-of-the-money options. We recently wrote about the uniqueness of option implied volatility and skew in stocks that are experiencing large price movements like GameStop (you can read that here). […]