The Broader Markets
Last Week – After a down move to start the week the SPY was higher by about 2% last week, in line with the 2.1% move options were pricing. That’s 2 straight weeks of moves in line with option pricing following 3-4 weeks of moves that far outpaced option pricing.
This Week – SPY options are pricing a 2% move for the upcoming week.
Implied Volatility / VIX – The VIX closed the week below 25, down from 27.50 the week before. Implied volatility is now approaching early June levels. The VIX futures curve is now upward sloping to the end of the year with Sept, Oct, Nov and Dec futures still above 28.
Expected Moves for This Week (via Options AI)
- SPY 2% (+/- $8)
- QQQ 2.6% (+/- $8)
- IWM 2.5% (+/- $4.50)
- DIA 1.7% (+/- $5.50)
In the News
After the close Friday news broke that Elon Musk is trying to back out of his deal to buy Twitter (TWTR). This was not a huge surprise to the markets as TWTR was already trading -35%+ to its announced deal price. The stock was down an additional 5% after hours Friday. Tesla (TSLA) stock was higher last week, and was up after hours Friday on the news. The stock had not performed well since Musk’s TWTR takeover was announced and investors in TSLA seem happier without the distraction. Tesla stock was near $770 after hours on Friday, up from $680 the week before. From last week’s preview:
TSLA stock is trading near the same price of a year ago and is down about 45% from its all time highs above $1200. Options, which have underpriced moves in the stock (higher and lower) during its large swings of the past year are now pricing about a 15% move for the rest of July and about a 35% move by year end.
TSLA already made the move options were pricing for all of July before the calendar hit the 9th of July. It’s now pricing about an 11% move for the rest of the month.
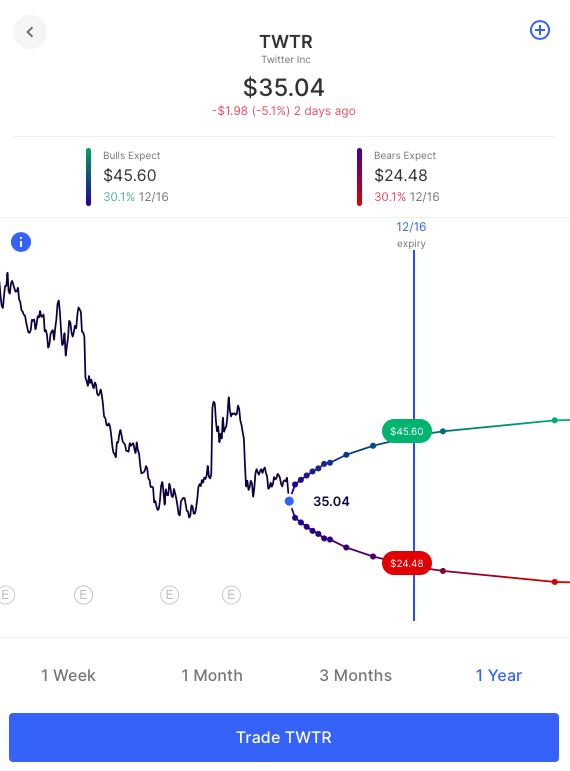
The Musk / Twitter news may have been portrayed as a surprise over the weekend in the media, but clearly markets weren’t pricing a big chance of it happening. TWTR options were pricing a bullish consensus of about $46 in the stock out to December, well below the announced takeover price. The bearish consensus in December is about $25:
Education
Last week’s preview included a primer on spreads vs single leg options. This week we dive in a little more on spreads vs a common option strategy.
SPREADS FOR INCOME
When we execute an options strategy where we receive net Premium (Credit) from selling options and this Credit represents the maximum potential gain (Max Gain) of the trade, we are often said to have executed an income-generating trade.
Back to basics: Covered Call
Perhaps the simplest and most common example of an income generating strategy is the Covered Call or Buy-Write. Here, we sell a Call option, typically against a corresponding long position in the underlying stock and with a Strike price above where the stock is currently trading. If the stock moves up and through our Breakeven level at expiration, our upside potential in the underlying stock is capped and we run the risk of being called-away. If the stock price remains below our Strike, then we keep the Premium received and can apply this Income to our overall portfolio rate of return (or see it as having boosted the yield of the underlying stock).
We have sold a Call option, so we know that PoP is likely in our favor (relative to having bought a Call) but that our upside in the underlying stock is capped at our Breakeven and we must remain long this equivalent number of underlying shares in order for our risk to be defined.
Credit Call Spread
We will start by looking at whether even the basic Covered Call might be made smarter by turning it into a Credit Call Spread.
Let’s use an example where we own 100 shares of XYZ and the stock is currently trading at $100. We want to add income but do not want to get called-away or sell our underlying stock position. So, as a first step, we look at the Expected Move for our expiration date. The options market is pricing a 3.0% move for the stock in the next 30 days. We do not disagree with this consensus and so the lowest strike Call option that we are prepared to sell is 103. We sell this Call and collect $1.00 in premium, giving us a Breakeven of $104.00. We keep all of this $1.00 premium if the stock is below $103 at expiration.
Now let’s turn the above into a Credit Call Spread by simultaneously buying a higher strike Call against our 103 short call. We decide to buy the 105 strike Call, creating the 103/105 XYZ Credit Call Spread. Since the 105 Call costs around $0.25 the net premium we collect is now $0.75 rather than $1.00 and our Breakeven has lowered to $103.75.
So, why might we want to reduce the amount of income we are receiving and lower our Breakeven level by trading a Credit Call Spread rather than a Covered Call?
Worry less about missing big moves or getting called away
Firstly, with a Covered Call, all gains in the underlying stock are capped at our Breakeven of $104. With the Credit Call Spread, our loss zone is defined and capped at our higher strike of 105. So, should the underlying stock be subject to an unforeseen outsized move upwards, we get to participate in those stock gains above $105. In other words, we have traded $0.25 less income for our ability to participate in the underlying stock moving above $105 (or a greater than 5% move). Giving us peace of mind that we won’t entirely miss out if the stock has an outsized move upwards.
Next week we’ll take this subject a little further and talk about the example of a credit call spread and how it can be used as a potential income-generating strategy even when the contracts of the spread are greater than the shares held in the underlying, a potential advantage for investors vs a covered call that needs to be 1 to 100.
Earnings
Links below go to the Options AI calendar where you can see the other companies each day and click through to see charts (free to use). Recent earnings moves (actual) start with the most recent:
- Fastenal FAST / Expected Move: 4.5% / Recent moves: +2%, -1%, +3%
- Delta DAL / Expected Move: 6.1% / Recent moves: +6%, +2%, -6%
- JP Morgan JPM / Expected Move: 3.5% / Recent moves: -3%, -6%, -3%
- Morgan Stanley MS / Expected Move: 3.5% / Recent moves: +1%, +2%, +3%
- Taiwan Semi TSM / Expected Move: 4.6% / Recent moves: -3%, +5%, +2%
- Wells Fargo WFC / Expected Move: 4.5% / Recent moves: -4%, +4%, -2%
- Citi C / Expected Move: 4.1% / Recent moves: +2%, -1%, +1%
- United Health UNH / Expected Move: 3.2% / Recent moves: 0%, 0%, +4%
Based upon publicly available information derived from option prices at the time of publishing. Intended for informational and educational purposes only and is not any form of recommendation of a particular security, strategy or to open a brokerage account. Options price data and past performance data should not be construed as being indicative of future results and do not guarantee future results or returns. Options involve risk, including exposing investors to potentially significant losses and are therefore not suitable for all investors. Option spreads involve additional risks that should be fully understood prior to investing. Securities trading is offered through Options AI Financial, LLC, member FINRA and SIPC.