The Broader Markets
Last Week – SPY was higher by 2.4% last week, a little more than the 2% move options were pricing.
This Week – SPY options are again pricing a 2.1% move for the upcoming week.
Implied Volatility / VIX – The VIX closed the week near 23, down slightly on the week.
Expected Moves for This Week (via Options AI)
- SPY 2.1% (+/- $8)
- QQQ 2.8% (+/- $8.50)
- IWM 2.6% (+/- $5)
- DIA 1.7% (+/- $5.50)
In the News
More than a third of the companies in the S&P 500 report this week including Microsoft, Alphabet (Tuesday), Meta (Wednesday) and Apple, Amazon (Thursday). In addition, the end of the week will see potential market moving economic data with GDP on Thursday, employee cost and personal consumption (inflation data) and home prices on Friday.
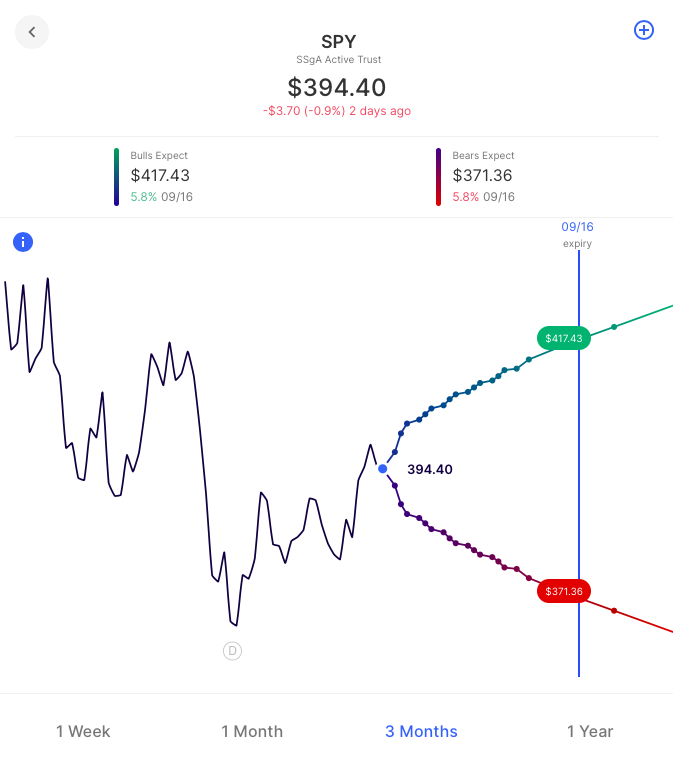
Since the begining of June the SPY has traded in a range of $365 to $417. It now sits slightly above the middle of that range. Those highs and lows are roughly 6% away in either direction. One of the ramifications of the recent move higher in the market has been a drop in implied volatility. Therefore the options market isn’t pricing a 6% move until mid-September to the highs and lows of the recent range:
Education
Last week we focused on credit call spreads, and how they can be used as a potential income-generating strategy even when the contracts of the spread are greater than the shares held in the underlying, a potential advantage for investors vs a covered call that needs to be 1 to 100. This week we’ll flip the concept to the downside, with Credit Put Spreads
Credit Put Spread (or Bull Put Spread)
Let’s turn to applying everything that we’ve covered on Credit Call Spreads in previous weeks to the opposite side – Credit Put Spreads.
Here, our basic strategy for initial comparison is selling a Cash-Secured (or Naked) Put. Here, we typically sell an out-the-money Put option below where the stock is currently trading. We’ll again use the example of XYZ stock currently trading at $100. The options market is pricing a 30-day Expected Move of approximately 3% in either direction, so we decide to use this for guidance and sell a XYZ 97 strike Put option and collect $1 in premium – giving us a Breakeven of $96 in the underlying stock.
The income of $1 ($100) is our Max Gain, but our Max Loss is theoretically the stock going to zero. If the stock price is below our Strike at expiration, we must either pay whatever is required to close our position, or risk being assigned (or being ‘Put’ the stock and therefore owning underlying shares) at our strike price. In addition, since we have the obligation to buy the stock at our strike price and our risk is not defined, our margin (or capital) requirement is the full value of the potential stock position. This can make the strategy highly capital intensive.
So, now we turn the Naked Put into a Credit Put Spread by simultaneously buying a lower strike Put against our short Put. We decide to buy the 95 strike Put creating the 97/95 XYZ Credit Call Spread. Since the 95 Put costs around $0.35 the net premium we collect is now $0.65 rather than $1.00 and our Breakeven has risen to $96.35.
So, why might we want to reduce the amount of income we are receiving and increase our Breakeven level by trading a Credit Put Spread rather than a Naked Put?
Define our risk and reduce our capital outlay
In the example above, selling a Naked Put at 97 means our potential risk is the stock going to zero and we may be forced to buy (be assigned) 100 shares of stock at a price of $97. We must therefore post $ 9,700 in margin against the position. Assuming we realize Max Gain on the position (keeping the $100 premium collected from the Put sale), we stand to make a potential return of approximately 1% on our capital. In addition to a relatively low potential return we also have a relatively high risk/reward ratio.
By switching to a 97/95 Credit Put Spread we define our downside risk in the underlying stock at $95. Our Max Loss is now $1.35 (the width of the spread ($2) less the premium we collected ($0.65)) and our total margin or capital requirement is $200 rather than $ 9,700. Should we realize Max Gain ($65) then our return on capital is now approximately 32% and our risk/reward ratio has improved considerably.
Credit Put Spreads for Income
Many investors use the Credit Put Spread as an income generating strategy when they believe that a stock will remain above a certain level at expiration. This level might be set by charting a support level, using the Expected Move, or simply by moving a Credit Spread far enough out-the-money that a desired risk, reward and probability ratio can be found. Each of these methods is made simple and visual on the Options AI options trading platform and, since risk is defined, the strategy can be deployed as an income generating without requiring capital to acquire the underlying stock.
Earnings
Links below go to the Options AI calendar where you can see the other companies each day and click through to see charts (free to use). Recent earnings moves (actual) start with the most recent:
- Microsoft MSFT / Expected Move: 4.2% / Recent moves: +5%, +3%, +4%
- Alphabet GOOGL / Expected Move: 6.0% / Recent moves: -4%, +8%, +5%
- United Parcel UPS / Expected Move: 6.5% / Recent moves: -3%, +14%, +7%
- Visa V / Expected Move: 4.6% / Recent moves: +6%, +11%, -7%
- General Motors GM / Expected Move: 5.2% / Recent moves: +2%, -1%, -5%
- Chipotle CMG / Expected Move: 5.6% / Recent moves: +3%, +10%, -3%
- Shopify SHOP / Expected Move: 11.2% / Recent moves: -15%, -16%, +7%
- Meta META / Expected Move: 10% / Recent moves: +18%, -26%, 0%
- Boeing BA / Expected Move: 5.4% / Recent moves: -8%, -5%, -2%
- Spotify SPOT / Expected Move: 10.2% / Recent moves: -17%, +8%, -6%
- Apple AAPL / Expected Move: 4.2% / Recent moves: -4%, +7%, -2%
- Amazon AMZN / Expected Move: 6.1% / Recent moves: -14%, +14%, -2%
- Intel INTC / Expected Move: 6.7% / Recent moves: -7%, 7%, -12%
- Roku ROKU / Expected Move: 13.2% / Recent moves: +1%, -22%, -8%
- Exxon Mobile XOM / Expected Move: 3.9% / Recent moves: -2%, +6%, +0%
- Chevron CVX / Expected Move: 3.9% / Recent moves: -3%, +4%, +1%
Option trading without the legwork: get started with an Options AI platform subscription today!
Based upon publicly available information derived from option prices at the time of publishing. Intended for informational and educational purposes only and is not any form of recommendation of a particular security, strategy or to open a brokerage account. Options price data and past performance data should not be construed as being indicative of future results and do not guarantee future results or returns. Options involve risk, including exposing investors to potentially significant losses and are therefore not suitable for all investors. Option spreads involve additional risks that should be fully understood prior to investing. Securities trading is offered through Options AI Financial, LLC, member FINRA and SIPC.