
Market View
Last Week – Late rally saves the week.
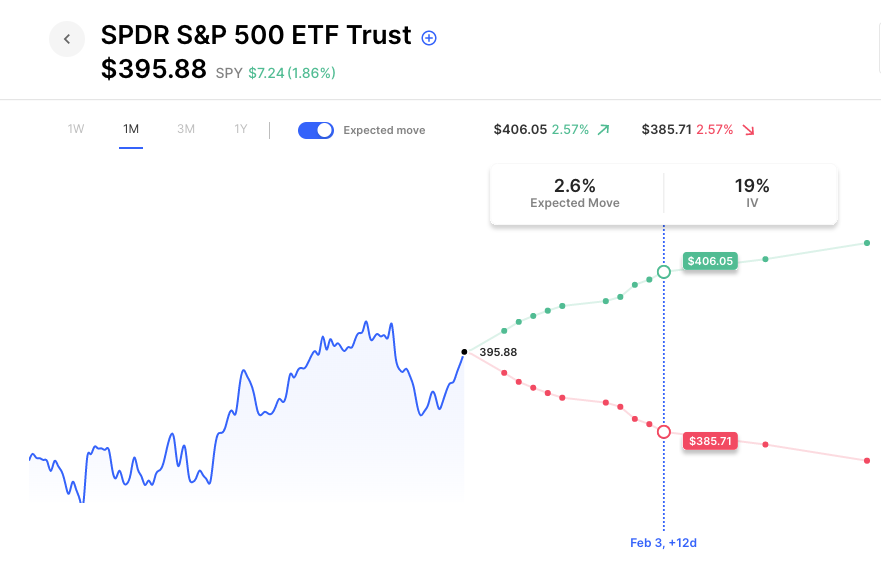
SPY was lower by about 0.6% last week but ended on a strong note with a near 2% rally off its lows of the week on Thursday. The move on the week was inside the 1.3% move options were pricing. The VIX ended the week unchanged as did near-term IV, with SPY options still in the low to mid-teens for the next two weeks. Things change the first week of February as we hear from the FOMC and see the latest employment and inflation data. Those weeks have consistently seen higher IV across the market, looking almost like a monthly earnings report on the expected move chart (Feb 3rd IV highlighted, note the bulge in the expected move chart for that week):
This Week – Again, relatively Low IV into this week’s earnings.
Last week we highlighted how market vol is low compared to what we’ve seen over the past year, and that low vol has arrived as earnings season heats up. That means we may continue to see examples of options pricing earnings moves lower than typical moves in the same stock over the past year. Last week, we highlighted Goldman Sachs (GS), a stock that had risen 6% the week before on the heels of the positive CPI reaction and earnings from JP Morgan. Despite that move into earnings, options were only pricing a 2.6% move for the actual earnings report. Goldman of course missed, and the stock was down nearly 9% on the week. This is something to be aware of around upcoming earnings. One way to gut-check where current vol is versus historical averages is to look at the realized 250 (trading days) stat versus the IV for this week. Last week, we highlighted the fact that GS options were about 25 IV for earnings, yet the stock had traded at about 29 IV for the past year. That indicated relative low IV into earnings.
Looking at some of the big names reporting this week, we see MSFT options 41 IV versus about 36 realized vol for the past year. So MSFT options are pricing a move for earnings slightly more than an average week (but not by much). TSLA options are similar, 81 IV this week versus 67 realized the past year. INTC options stick out as quite pumped versus the past year. IV for this week is 67 versus 39 realized for the past year. INTC has actually moved a lot on its recent earnings, with moves of +10%, -9%, -7%, and 7% (with the +10% most recent). That helps explain this week’s 7% expected move.
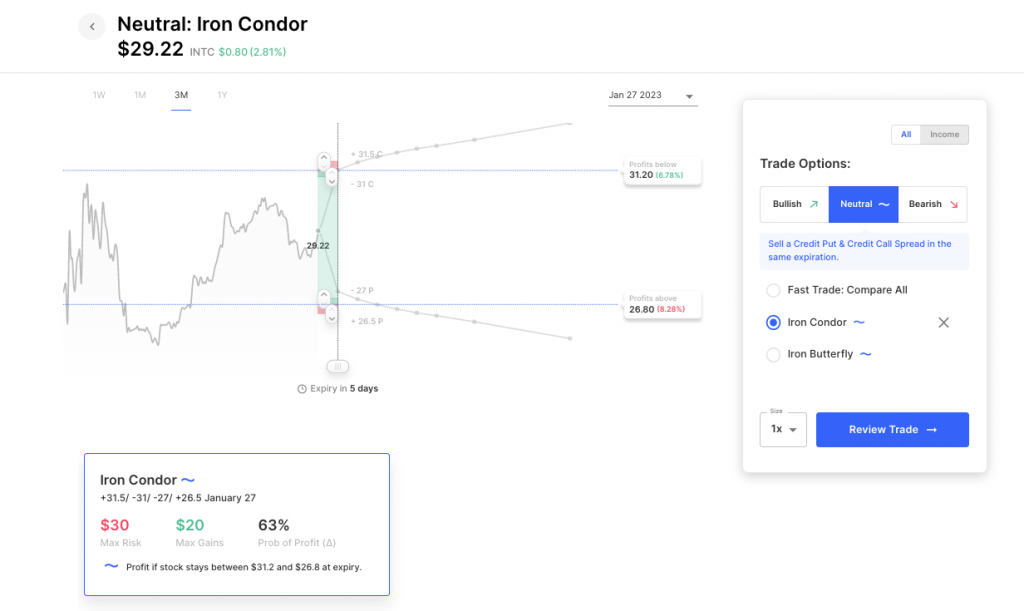
So looking at those 3 examples, there are none that are as low as the situation we saw last week in GS, but among the three MSFT options are the cheapest versus last year’s realized and INTC’s are the most expensive, needing a move similar to what the stock saw its past 4 earnings in order for options to not have been overpriced. As an example of a neutral trade, selling that earnings move, an Iron Condor expiring this Friday in INTC would currently need the stock to close the week between 26.80 and 31.20 following its report to see max gain. Here’s how that looks on a 3-month stock chart (see this trade and others on Options AI’s free trade tool):
Expected Moves for This Week (via Options AI free tools)
- SPY 1.5%
- QQQ 2.0%
- IWM 1.9%
- DIA 1.3%
Economic Calendar
- Tuesday – Global PMI
- Thursday – GDP, Durable Goods, Capital Goods, Initial Jobless Claims
- Friday – UoM Consumer Sentiment
High Options Volume This Past Friday (compared to 30-day averages)
- JWM, IBM, TTWO, SAVE, APRN, SPY, AVGO
Earnings This Week
Via the Options AI Earnings Calendar. Expected move, weekly IV, and prior earnings moves (starting with most recent).
Tuesday
- Microsoft MSFT / Expected Move: 4.1% / IV 41 / Prior moves: -8%, +7%, +5%, +3%
- Texas Instruments TXN / Expected Move: 4.2% / IV 41 / Prior moves: -3%, +7%, +1%, +3%
Wednesday
- Boeing BA / Expected Move: 4.1% / IV 41 / Recent moves: -9%, 0%, -8%, -5%
- Tesla TSLA / Expected Move: 8.2% / IV 81 / Recent moves: -7%, +10%, +3%, -12%
- ServiceNow NOW / Expected Move: 6.6% / IV 65 / Recent moves: +12%, -3%, +8%, +9%
- IBM IBM / Expected Move: 4.1% / IV 41 / Recent moves: +5%, -5%, +7%, +6%
Thursday
- Southwest LUV / Expected Move: 4% / IV 41 / Recent moves: +3%, -6%, +2%, -2%
- Intel INTC / Expected Move: 6.8% / IV 67 / Recent moves: +10%, -9%, -7%, -7%
- Visa V / Expected Move: 3.5% / IV 35 / Recent moves: 0%, +5%, -1%, +6%
Friday
- Chevron CVX / Expected Move: 2.9% / IV 29 / Recent moves: +1%, +9%, -3%, -4%
- American Express AXP / Expected Move: 3.9% / IV 38 / Recent moves: -2%, +2%, -3%, +9%
Based upon publicly available information derived from option prices at the time of publishing. Intended for informational and educational purposes only and is not any form of recommendation of a particular security, strategy or to open a brokerage account. Options price data and past performance data should not be construed as being indicative of future results and do not guarantee future results or returns. Options involve risk, including exposing investors to potentially significant losses and are therefore not suitable for all investors. Option spreads involve additional risks that should be fully understood prior to investing. Securities trading is offered through Options AI Financial, LLC, member FINRA and SIPC.