The Broader Markets
Last Week – SPY closed on Friday down 1.5% on the week, inside the 2.2% move options were pricing. That move lower, even though it was inside what options were pricing was enough to drive implied volatility higher.
This Week – SPY options are pricing about a 2.7% move this week (about $12 in either direction).
Implied Volatility / VIX – The VIX closed last week near 32, up from 27 the prior Friday.
Expected Moves for This Week (via Options AI)
- SPY 2.7% (about $12)
- QQQ 3.3% (about $11)
- IWM 3.3% (about $6.50)
- DIA 2.4% (about $8)
In the News
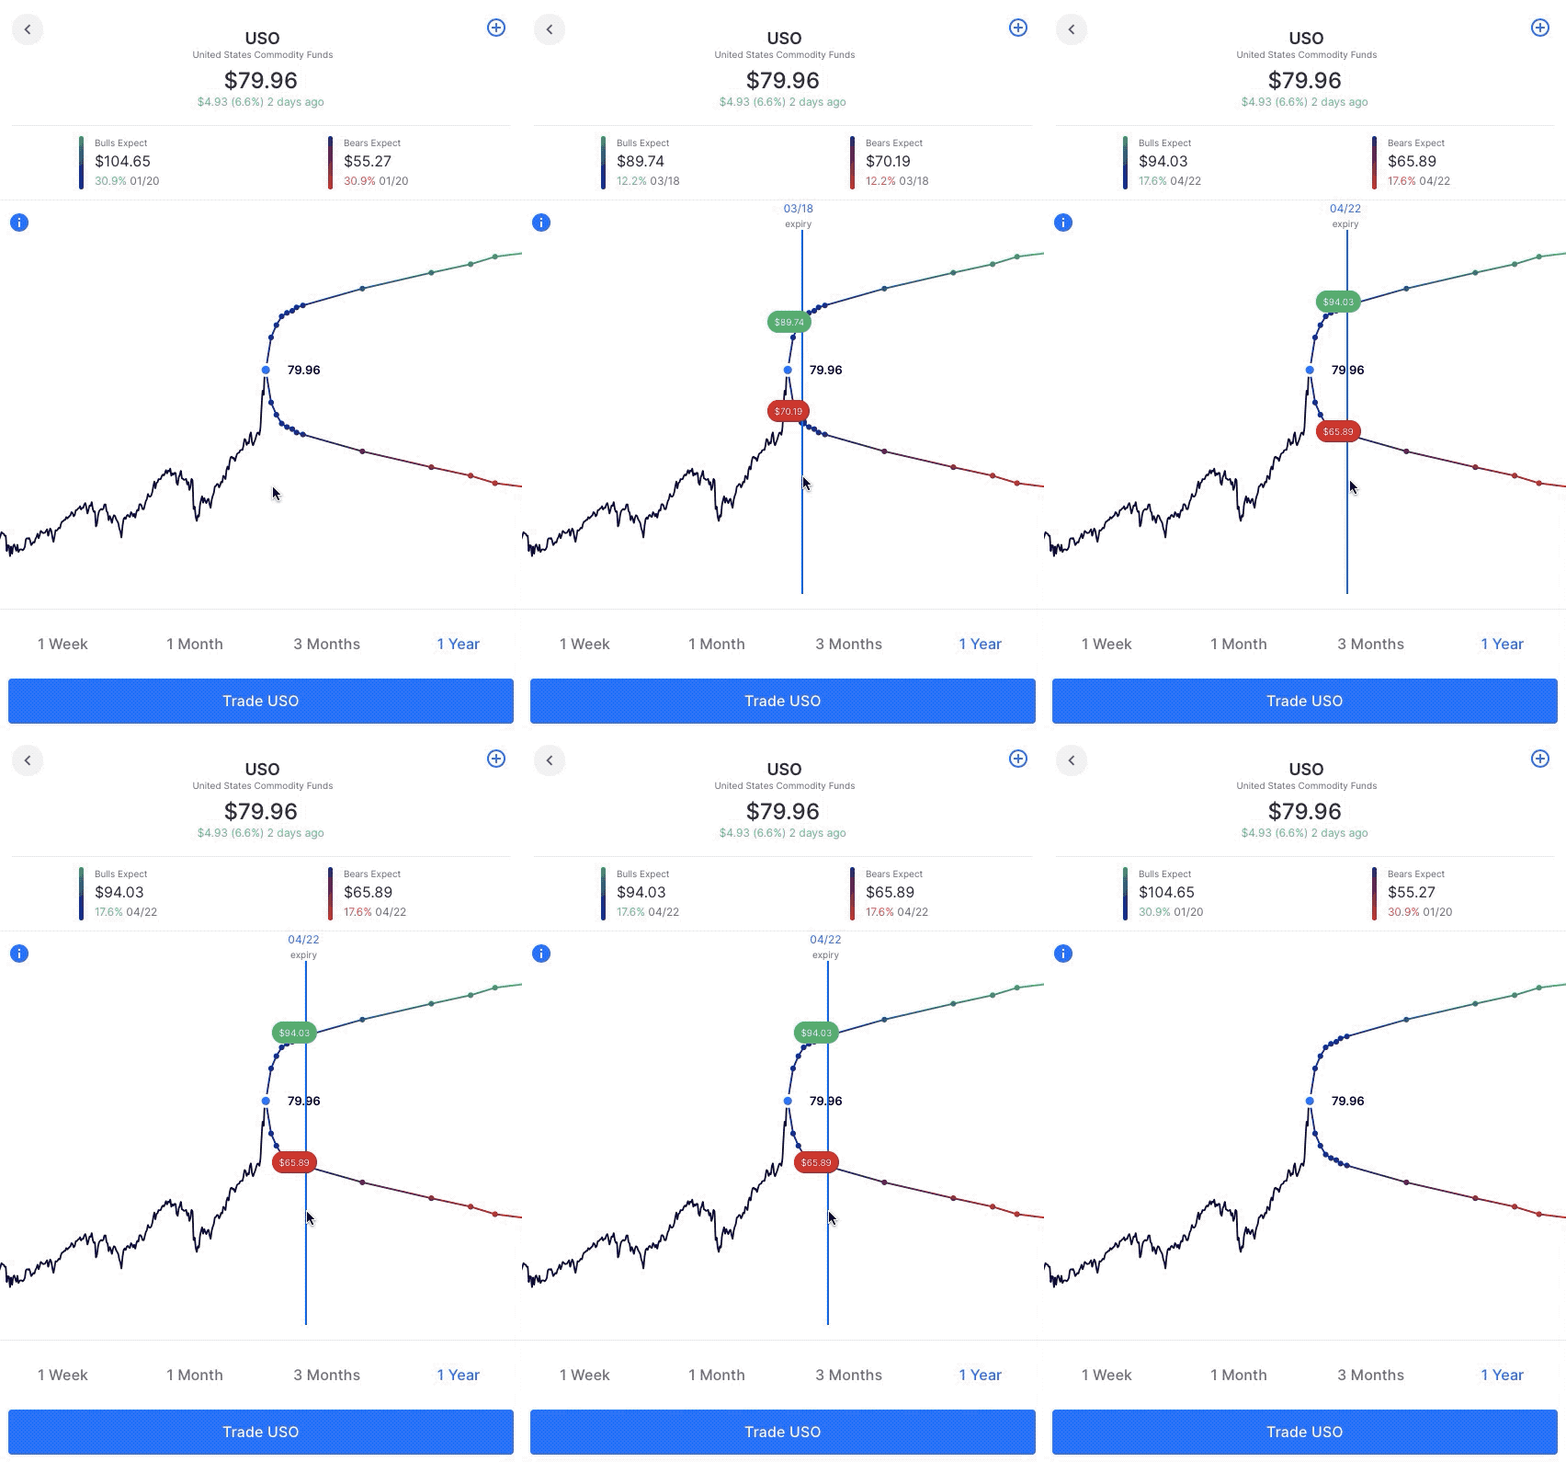
USO, the United States Oil fund, is up more than 20% in the past two weeks and is up more than 60% in the last 3 months. When commodities “crash” higher, volatility spikes. USO options are pricing in a 9% move for the upcoming week, and 18% out to April 22nd. Its 30 day implied volatility is 230% higher than its 1 year realized volatility, its IV rank is 100, as are names in energy like XOM, CVX, BTU and OXY. Option volume is also spiking. On Friday, OXY saw 825% more options traded than on a 30 day average. USO saw 350% more volume than on average. Here’s the expected move chart in USO, options are pricing a range of about $66 to $95 out to April 22nd:

Earnings
Links go to the Options AI calendar where you can see the other companies each day and click through to see charts (free to use). Recent earnings moves (actual) start with the most recent:
MongoDB MDB / Expected Move: 13.5% / Recent moves: +16%, +26%, +16%
Dick’s Sporting DKS / Expected Move: 10.8% / Recent moves: -4%, +13%, +17%
Crowdstrike CRWD / Expected Move: 11% / Recent moves: +4%, -4%, -4%
Oracle ORCL / Expected Move: 7.4% / Recent moves: +16%, -3%, -6%
JD.com JD / Expected Move: 8.2% / Recent moves: +6%, +3%, -9%
Docusign DOCU / Expected Move: 17.3% / Recent moves: -42%, +5%, +20%
Rivian RIVN / Expected Move: 15.7% / Recent moves: -10%
Ulta Beauty ULTA / Expected Move: 7.8% / Recent moves: -1%, 0%, +5%
Blink BLNK / Expected Move: 7.8% / Recent moves: +1%, +12%, -5%
Based upon publicly available information derived from option prices at the time of publishing. Intended for informational and educational purposes only and is not any form of recommendation of a particular security, strategy or to open a brokerage account. Options price data and past performance data should not be construed as being indicative of future results and do not guarantee future results or returns. Options involve risk, including exposing investors to potentially significant losses and are therefore not suitable for all investors. Option spreads involve additional risks that should be fully understood prior to investing. Securities trading is offered through Options AI Financial, LLC a registered broker-dealer.


