Options AI mobile is now available in the Apple app store! Go find it here.
Good morning!
Today is once again slow on the earnings front, things kick off Thursday into Friday. For the next 24 hours or so things are about inflation data. This morning, we got the CPI and tomorrow we get the PPI. Equities have rallied into the number and they must have been on to something as the CPI came in cooler than expected. Futures rallied on the print and short-term treasury yields sold off sharply. This probably doesn’t stop the Fed from more rate hikes but it does give the market some sense that inflation isn’t out of control while the Fed remains hawkish, a worst-case scenario.
Now onto earnings, you heard it here first (last week), but Goldman Sachs put some interesting data to how historically low expected moves are for the upcoming earnings season:
“the average S&P stock is implying only a +/- 3.6% move on its earnings day vs. the long-term average of 4.9%. The current level is the lowest implied move over the entire 15-year period”
As mentioned last week in this space (using Netflix as an example) IV has fallen so far across the board that options in individual stocks are pricing moves for their reports that are less than most of the actual moves these stocks have seen over the past 2 years (of often high vol). Goldman takes the data back even further to show that on average these are some of the smallest expected moves in more than a decade. What’s that mean for traders? Low IV can often be prescient and somewhat self-fulfilling. On average one would expect smaller actual moves across the board than during high IV / VIX conditions, obviously.
HOWEVER, one can also expect that with smaller expected moves, the number of actual moves larger than expected will also rise. And the data bears this out. On average one can expect a stock to stay at or within its expected move about ~70% of the time. That number is higher when IV is high (meaning more stocks stay within their expected move when vol is high), and lower when IV is low. Which makes sense. If an expected move is $25 in either direction it’s a much harder target for a stock to reach than if the expected move is $10 in either direction.
So in practice, just selling premium into each earnings isn’t as successful across the board when vol is low, as when vol is high. Not to mention the premiums received are smaller. BUT, the actual (realized) moves across the board are smaller on average. Meaning far out of the money plays, either buying or selling are much less likely to become in the money. I’ll have more to say on this as we get into the earnings calendar. That really kicks off on Thursday into Friday and picks up serious steam next week.
Pre-Market Movers:
Some notable stocks making moves or active this morning.
- Healthcare Triangle Inc (HCTI) +123.93%
- Ault Alliance Inc (AULT) +145.45%
- Cadrenal Therapeutics Inc (CVKD) +68.97%
- Eloxx Pharmaceuticals Inc (ELOX) +23.09%
- Activision Blizzard (ATVI) -1.58%
- Xpeng Inc ADR (XPEV) +1.80%
- Riot Platforms Inc (RIOT) +1.43%
- Jd.com Inc ADR (JD) +2.97%
- Painreform Ltd (PRFX) -25.94%
- Redfin Corp (RDFN) -5.15%
- Liminal Biosciences Inc (LMNL) +43.24%
- Starbox Group Holdings Ltd (STBX) -3.19%
- Opendoor Technologies Inc (OPEN) +2.47%
Today’s Earnings Highlights:
Actively traded names reporting today:
- MillerKnoll, Inc. (MLKN) Expected Move: 10.14%
- AngioDynamics, Inc. (ANGO) Expected Move: 12.88%
Full list here: Options AI Earnings Calendar
Economic Calendar:
- At 07:00 AM (EST) MBA 30-Year Mortgage Rate (Jul/07) Impact: Medium
- At 08:30 AM (EST) CPI (Jun) Estimates: 305.219, Prior: 304.127
- At 08:30 AM (EST) Core Inflation Rate YoY (Jun) Estimates: 5, Prior: 5.3
- At 08:30 AM (EST) Core Inflation Rate MoM (Jun) Estimates: 0.3, Prior: 0.4
- At 08:30 AM (EST) CPI s.a (Jun) Estimates: 303.7, Prior: 303.294
- At 08:30 AM (EST) Inflation Rate MoM (Jun) Estimates: 0.3, Prior: 0.1
- At 08:30 AM (EST) Inflation Rate YoY (Jun) Estimates: 3.1, Prior: 4
- At 09:45 AM (EST) Fed Kashkari Speech Impact: Medium
- At 01:00 PM (EST) Fed Bostic Speech Impact: Medium
- At 04:00 PM (EST) Fed Mester Speech Impact: Medium
- At 06:45 PM (EST) Fed Waller Speech Impact: Medium
Full lists here: Options AI Free Tools.
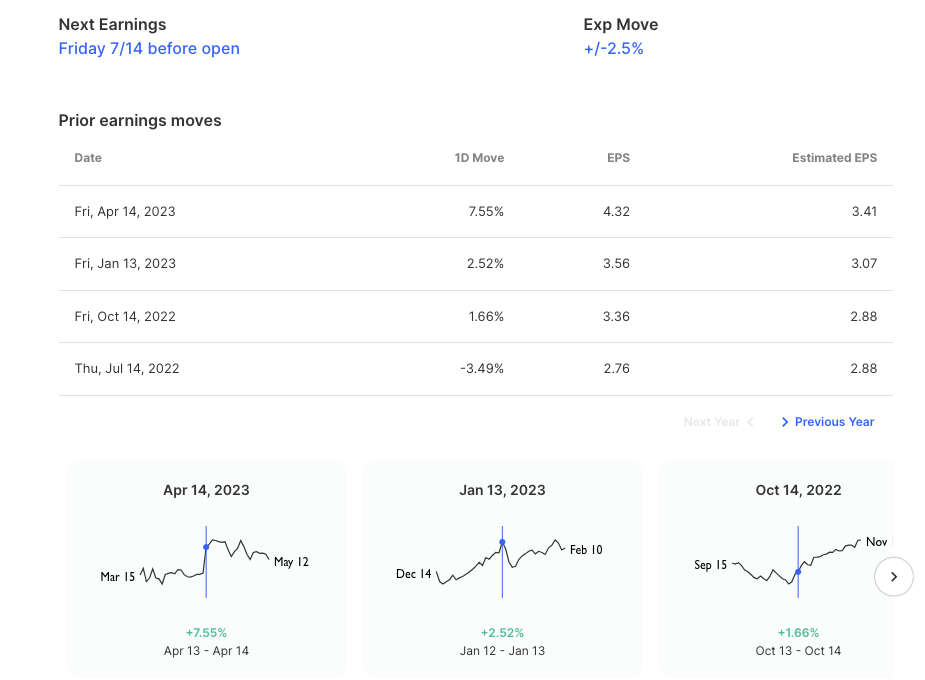
Chart of the Day:
JP Morgan options are pricing about a 2.5% move for earnings. The stock has moved 2.5% or more 6 out of the past 8 reports.
That’s all for now. Have a great day!
The Options AI Team

Based upon publicly available information derived from option prices at the time of publishing. Intended for informational and educational purposes only and is not any form of recommendation of a particular security, strategy or to open a brokerage account. Options price data and past performance data should not be construed as being indicative of future results and do not guarantee future results or returns. Options involve risk, including exposing investors to potentially significant losses and are therefore not suitable for all investors. Option spreads involve additional risks that should be fully understood prior to investing. Securities trading is offered through Options AI Financial, LLC, member FINRA and SIPC.