Spreads as Zones on a Chart
YOU DON’T NEED TO BE FLUENT IN GREEK TO ENJOY THE BENEFITS OF OPTION SPREADS
At Options AI, we see multi-leg options not as a bunch of numbers and old-fashioned pay-out diagrams, but as clear and simple zones of profit and loss on a chart. Zones that can be easily modified to find the right mix of risk, reward and probability of profit.
Not only does this help take the legwork out of more advanced trading, we think it also helps highlight how Spreads can sometimes be a smarter strategy than outright Calls or Puts.
Let’s first compare buying a Call to buying a Debit (Bull) Call Spread.
Example: Call vs. Debit Call Spread
Below, we compare buying a Call to a Debit Call Spread, using TSLA as an example.
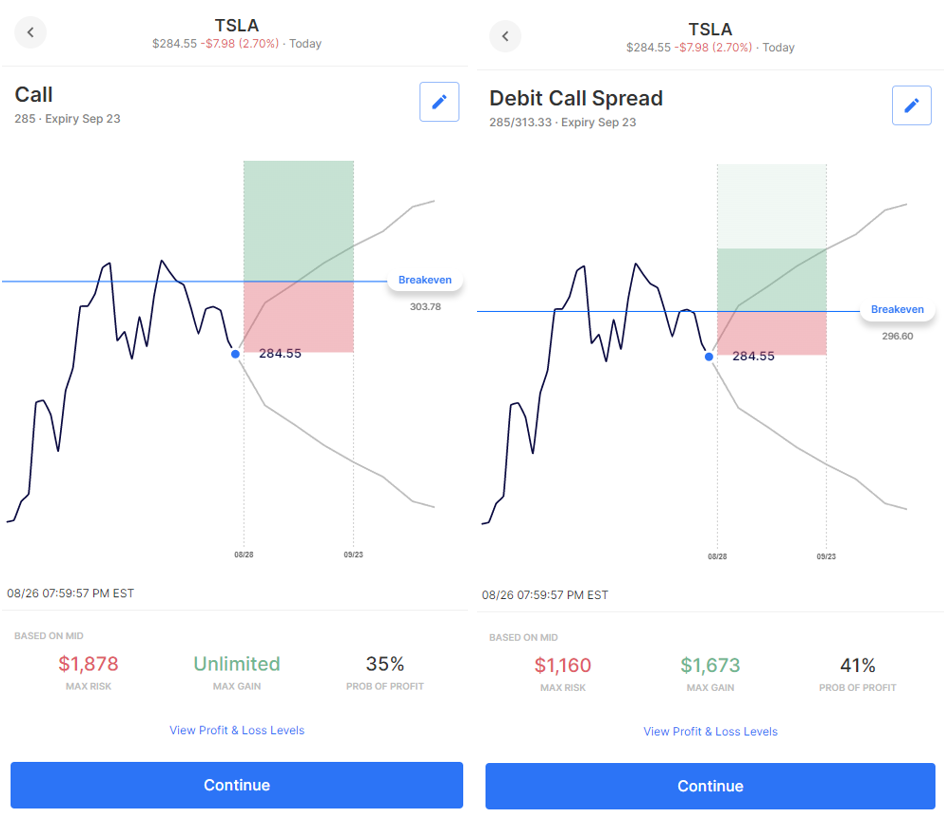
In both examples we buy a TSLA 285 Call, but with the Debit Call Spread we simultaneously sell a higher strike, 313 Call. The sale of this Call introduces a (light green) zone where profits are capped versus the outright Call where the (dark green) zone of increasing profits is uncapped. However, by accepting capped profits, we see that the Call Spread has allowed us to reduce our breakeven level and lower our cost (Max Risk), thereby also improving our Probability of Profit.
Options AI doesn’t just let you see Spreads differently. It helps you do Spreads differently. With just a few clicks using Fast Trade or setting Zones on a chart, find the strategy that’s right for you.
Example: Debit Call Spread vs. Credit Put Spread
Through visual comparison we’ve looked at some of the relative potential merits of using a Debit Call Spread versus buying an outright Call. Now, lets take this one step further by comparing a Debit Call Spread to another bullish spread strategy – the Credit Put Spread.
Firstly, if buying options (or buying a spread) can be seen as needing a stock to move beyond a breakeven level and into a profit zone, then selling options can be seen as needing a stock to stay inside a breakeven level and within a profit zone. In other words, when we sell options or sell a Spread for a Credit, we are taking a view on what won’t happen.
So, let’s compare the profit zones of a Debit and Credit Spread, again using TSLA as an example.
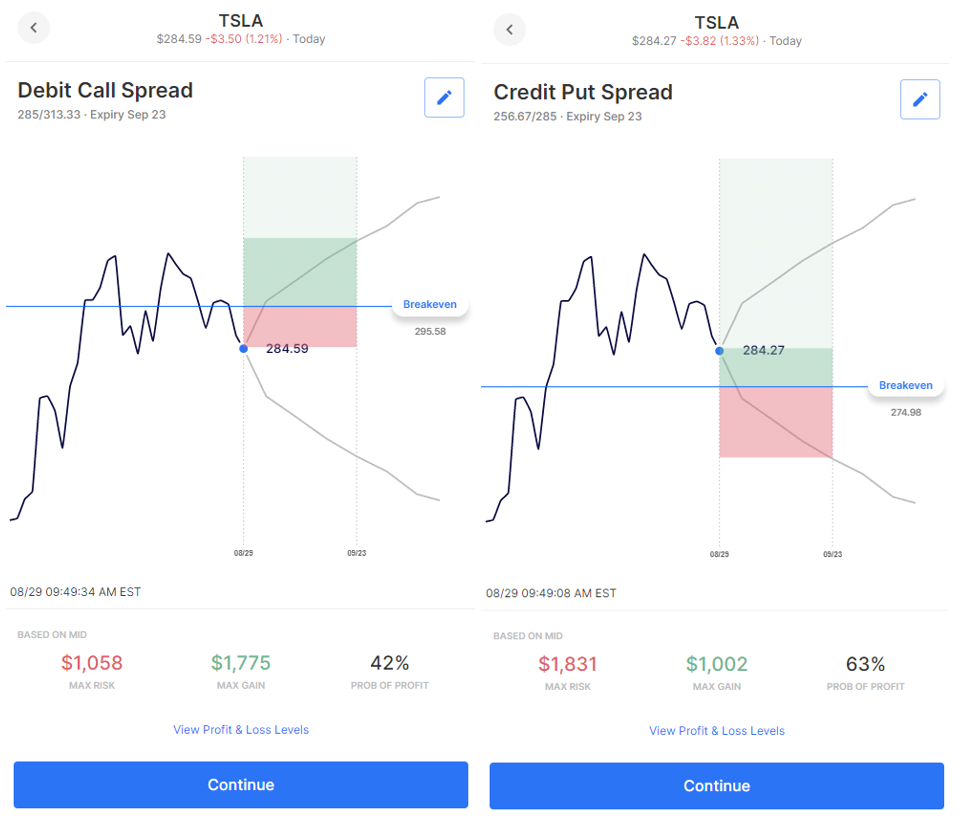
In this example, we setup a Debit Spread by buying the at-the-money Call and simultaneously selling a Call at the expected move to the upside. We then mirror this setup for an alternative bullish strategy – the Credit Put Spread – by selling the at-the-money Put and simultaneously buying a Put at the current expected move to the downside.
Immediately noticeable is that when buying a Call Spread, we need the stock to make a significant move (in this case upwards) from its current level, for us to realize a potential profit. And, if we had simply bought a Call rather than a Call Spread, this breakeven would be even higher. In contrast, when selling a Credit (Bull) Put Spread, our breakeven level is actually below where the stock is currently trading. By selling options to the bears, we have created a setup where we now need the stock to remain above our breakeven level to realize a potential profit.
As can also be seen from this example, in creating a larger potential profit zone by lowering our breakeven, we also typically improve our probability of profit to above 50%. Our trade-off being that we must generally accept a higher risk to reward ratio.
Check out our options trading courses to learn concepts like spreads, covered calls, iron condors and more.