Market View
Last Week – SPY was higher by about 5.9% last week and has now bounced about 12% from the 2022 lows (made in mid October.) It is about 17% away from its all-time closing highs (Dec ’21).
The big move higher last week came after a tamer-than-expected CPI print that has market participants thinking the Fed is now done with its 75 basis point hikes.
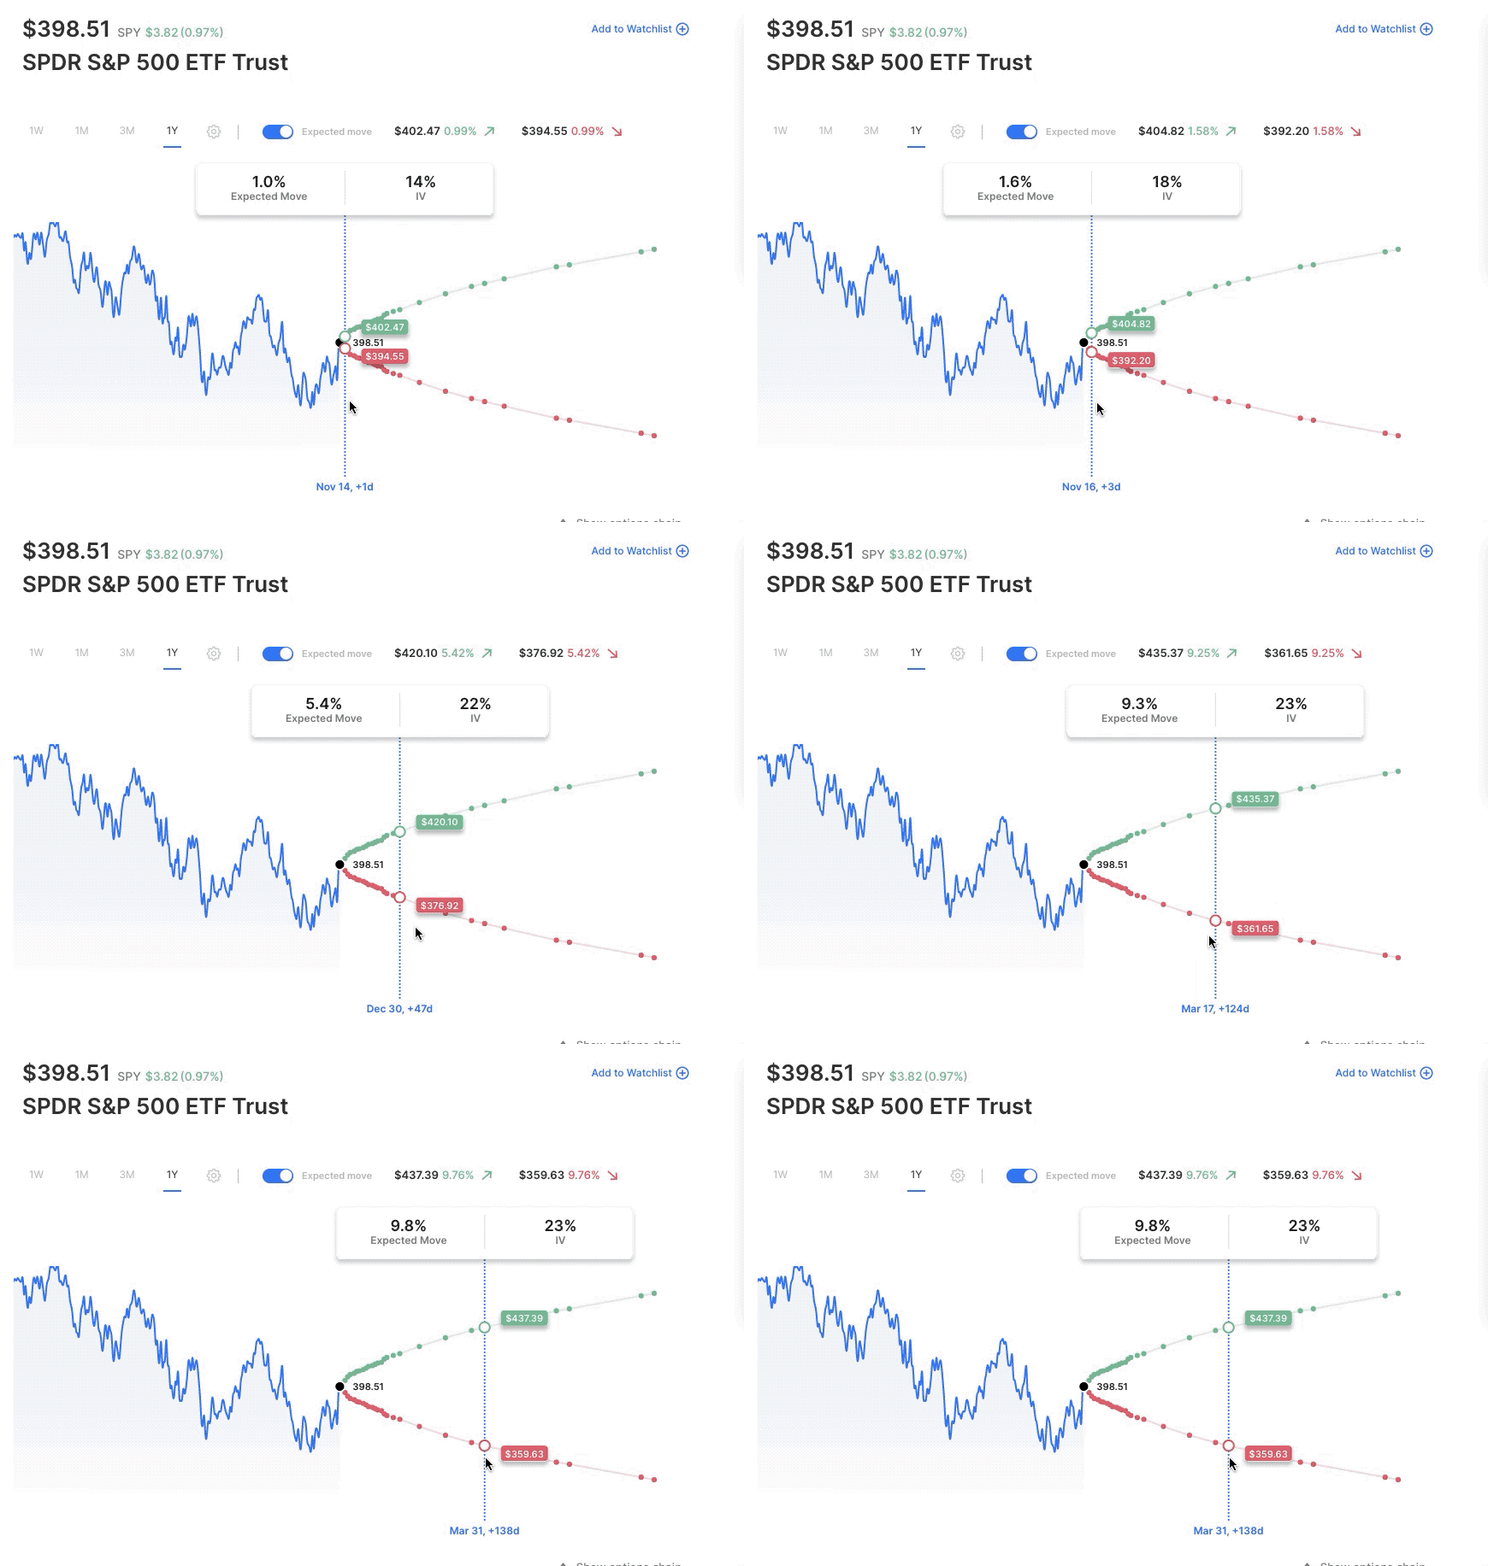
The 5.9% was obviously alot more than the 2.6% move options were pricing. But once again, because the move was to the upside, combined with most of the big cap earnings, the election, the FOMC decision, and CPI now behind us, vol continues to move lower. The VIX is now 22.5. Down from 34 in October. That declining vol has not been a reaction to options overpricing moves over the past month. In fact, the opposite has been true. What it is a sign of is worries of a crash, or continued move lower in the market, whether it be FOMC, Earnings, Election, or inflation data-driven, is now less of a likelihood in the near term. In fact, IV is now lower near-term, than it is out a few months, as seen by this 1 year SPY chart showing expected move levels and IV:

Bottom line, with the IV crush that accompanied the market rip higher last week, options are not pricing in a retest of those recent lows anytime soon. (In fact, options aren’t pricing those lows or the near-term (August) high until late Winter.)
And IV, which is about 19 near term in SPY, increases as you go out expiries, with options out in March around 23 IV.
This Week – SPY options are pricing about a 2.0% move for the upcoming week or about $8 in either direction. That is down from a 2.6% ($10) move options were pricing last week (actual move ^$22).
Speaking of that $22 move higher, from last week’s post:
With IV coming in the past 2 weeks, the skew of options is shifting, with upside calls in SPY and QQQ now more expensive (relatively) to the at-the-moneys than they had been when IV was higher.
Last week didn’t just see a Powerball winner, it also saw some of those lotto ticket upside calls win as well. Perhaps some of it was positioning for the chance of a CPI induced squeeze.
The economic calendar this week sees Retail Sales (as well as several big retail earnings) here in the US. This could be a scenario where hot numbers would be bad for the market because of inflation implications.
Expected Moves for This Week (via Options AI)
- SPY 2.0% (+/- $8)
- QQQ 2.6% (+/- $7.50)
- IWM 2.4% (+/- $4.50)
- DIA 1.8% (+/- $6)
Economic Calendar
- Monday – Fed speeches: Williams, Brainard
- Wednesday – Retail Sales, Europe: Lagarde Speech
- Thursday – Intiial Jobless Claims
- Friday – Europe: Lagarde Speech
Earnings This Week
Expected moves for companies reporting this week. Recent moves indicate what the stock did in its past few reports (starting with the most recent). Also included is the 30-day (forward) IV vs the 1-year actual (realized, historical), which gives a sense of how options are pricing the moves relative to how the stock has traded over the past year.
Data is via the Options AI Earnings Calendar and other companies can be found at the link (free to use).
Tuesday
- Home Depot HD / Expected Move: 4.2% / Recent moves: +4%, +2%, -9%, +6% (30d IV vs 1yr: +4)
- Walmart WMT / Expected Move: 4.0% / Recent moves: +5%, -11%, +4%, -3% (30d IV vs 1yr: +6)
Wednesday
- Target TGT / Expected Move: 5.2% / Recent moves: +1%, -5%, 0%, 0% (30d IV vs 1yr: +21)
- Lowes LOW / Expected Move: 10.3% / Recent moves: 0%, +18%, -8%, -10% (30d IV vs 1yr: -12)
- Nvidia NVDA / Expected Move: 7.5% / Recent moves: +4%, +5%, -8%, +8% (30d IV vs 1yr: -7)
- Cisco CSCO / Expected Move: 5.1% / Recent moves: +5%, -14%, +3%, -6% (30d IV vs 1yr: +16)
Thursday
- Alibaba BABA / Expected Move: 8.5% / Recent moves: +2%, +15%, -1%, -11% (30d IV vs 1yr: -4)
- Applied Materials AMAT/ Expected Move: 5.6% / Recent moves: -3%, -4%, -3%, -5% (30d IV vs 1yr: -6)
Friday
- JD.com JD / Expected Move: 9.5% / Recent moves: +3%, +4%, -16%, +6% (30d IV vs 1yr: +4)
Our options trading videos teach you everything you need to learn options trading, covering buying and selling options, spreads and more.
Based upon publicly available information derived from option prices at the time of publishing. Intended for informational and educational purposes only and is not any form of recommendation of a particular security, strategy or to open a brokerage account. Options price data and past performance data should not be construed as being indicative of future results and do not guarantee future results or returns. Options involve risk, including exposing investors to potentially significant losses and are therefore not suitable for all investors. Option spreads involve additional risks that should be fully understood prior to investing. Securities trading is offered through Options AI Financial, LLC, member FINRA and SIPC.


