
Hello!
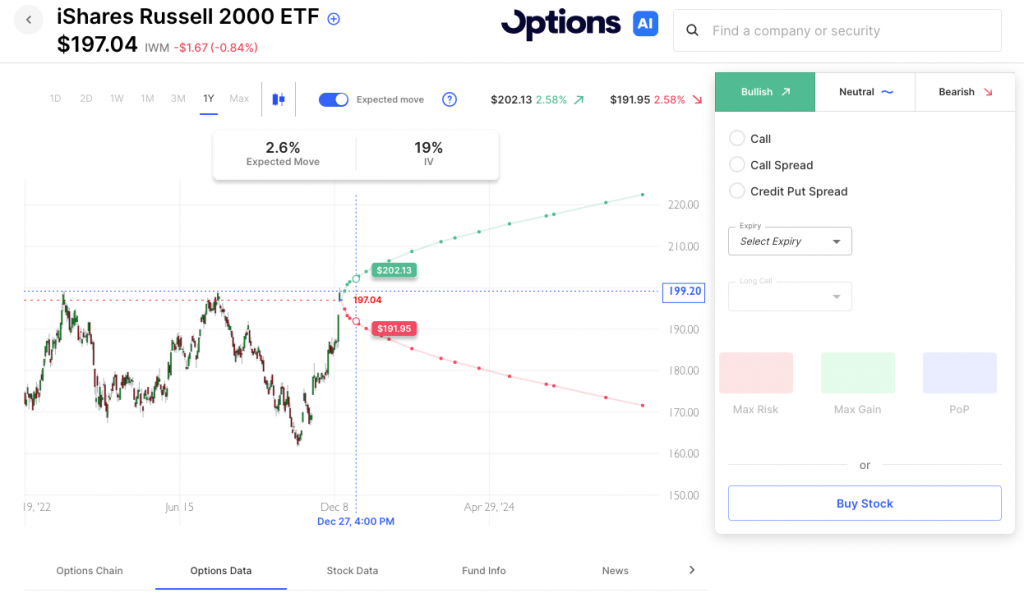
We enter what will be the last 5-day trading week of the year. Both Christmas Week and New Year will feature 3 day weekends with the holidays both falling on Monday. Due to the rally we’ve seen into year-end and the upcoming calendar implied vol is low across the board. The realized vol in the indices has been low as well, with moves mostly to the upside and red days not able to string together any sort of meaningful pullback. Small caps have shown the greatest relative strength recently. Note the IWM expected move below which has been seeing much more realized moves than the other major indices. IWM got near the 200 level last week but found some sellers above 199 on Friday. Keep an eye on that index for any breakout. Small caps ripping higher can inject some volatility back into the market as investors reach for upside calls for fear of missing out. The VIX printed below 12 briefly last week. Some of the lowest VIX prints tend to come in December and Early Jan historically.
The earnings calendar wraps up for the end of 2024 to some extent this week with FedEx, Nike, and Micron highlighting. The economic calendar starts quietly but has GDP and PCE at the end of the week.
Expected Moves (Week / 0DTE)
- SPY/SPX: week 1.0% / 0dte 0.4%
- QQQ: week 1.2% / 0dte 0.6%
- IWM: week 2.2% / 0dte 1.1%
Economic Calendar
- Tuesday – Housing Starts/Building Permits
- Wednesday – Existing Homesales
- Thursday – GDP, Initial Jobless Claims
- Friday – PCE
Earnings Expected Moves
Tuesday
- ACN Accenture plc 3.5%
- FDX FedEx Corporation 4.4%
- FCEL FuelCell Energy, Inc. 13.4%
Wednesday
- MU Micron Technology, Inc. 4.8%
- GIS General Mills, Inc. 3.9%
- BB BlackBerry Limited 9.1%
Thursday
- NKE NIKE, Inc. 5.1%
- KMX CarMax, Inc. 7.8%
- CCL Carnival Corporation & plc 7.1%
Chart of the Week
IWM attempting to get above that $200 level. Options are pricing about a 2.6% move into year-end which would be a breakout to the upside or a pullback to about $192:
Follow The Orbit on Twitter and Youtube
Based upon publicly available information derived from option prices at the time of publishing. Intended for informational and educational purposes only and is not any form of recommendation of a particular security, strategy or to open a brokerage account. Options price data and past performance data should not be construed as being indicative of future results and do not guarantee future results or returns. Options involve risk, including exposing investors to potentially significant losses and are therefore not suitable for all investors. Option spreads involve additional risks that should be fully understood prior to investing. Securities trading is offered through Options AI Financial, LLC, member FINRA and SIPC