
Hello!
Netflix NFLX reports after the close, one of the first big cap tech stocks to go this cycle. As a use case for earnings set-ups in general we are going to use that to go over some trading theory, whether neutral for potential income, bullish or bearish, and to serve as a partial checklist that can be helpful on other names.
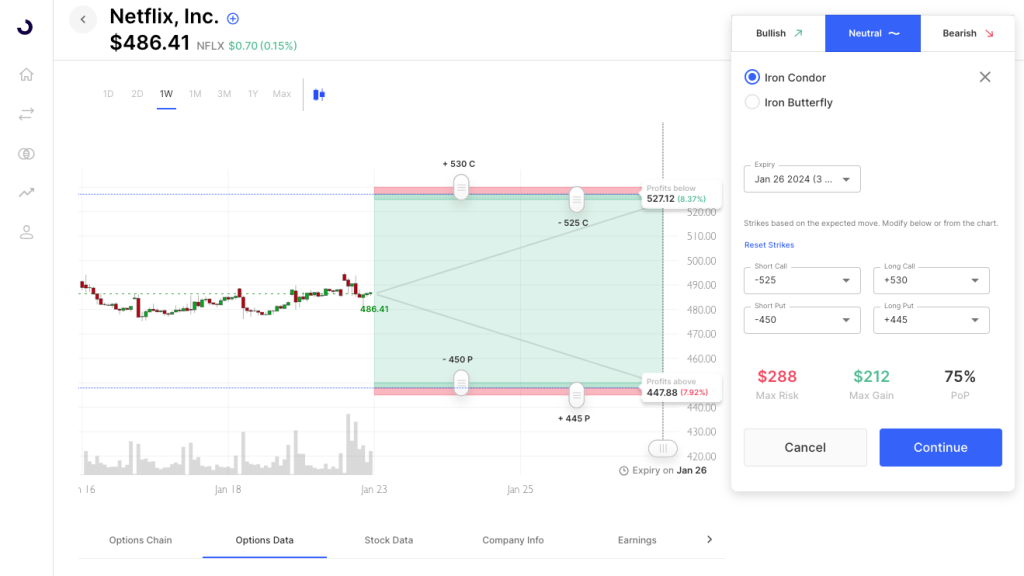
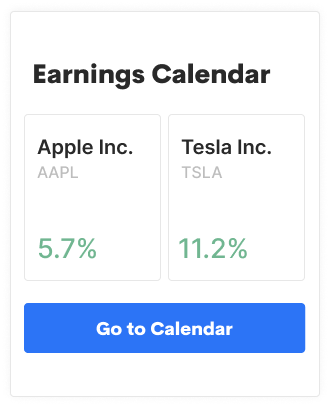
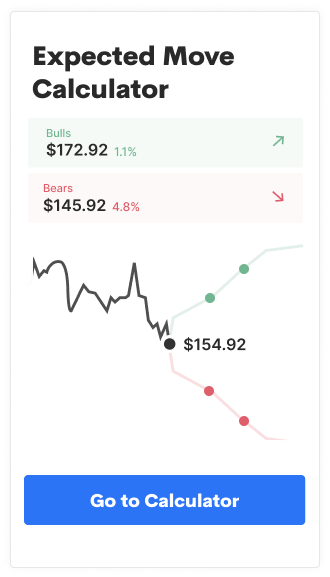
The expected move of about 7.7% has crept up slightly into the print. It is still about half of what the stock moved on the last earnings though and on the low side historically. (past 3 earnings move charts below). A move in line with the expected move has a range of about $450-$525. Using those strikes as short strike on a selling-the-move iron condor risks just shy of $300 to make a little more than $200.
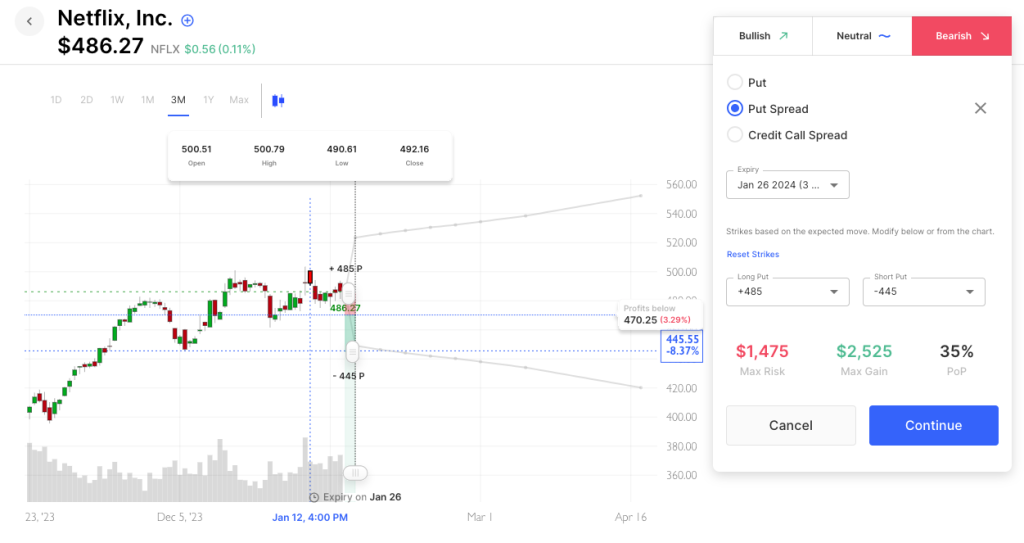
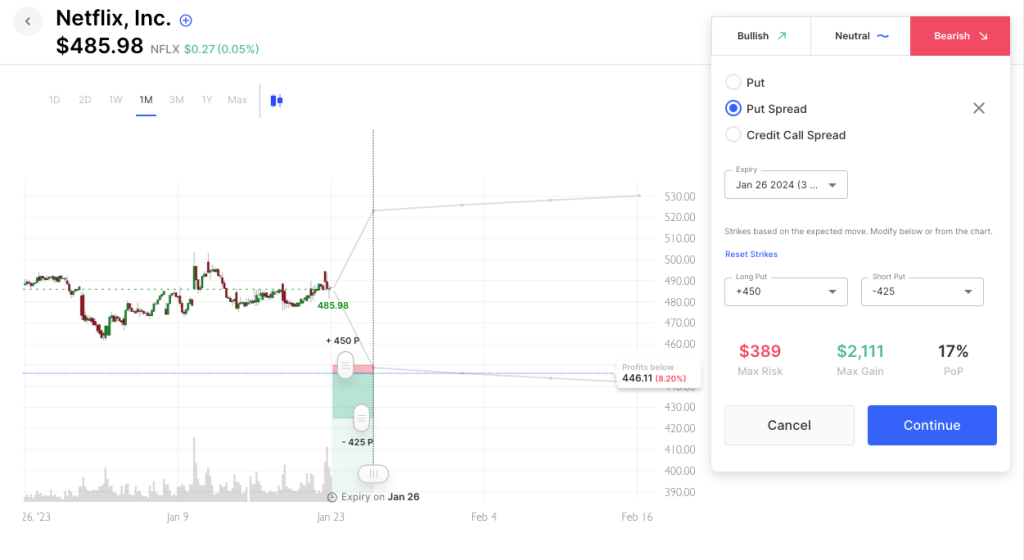
For those leaning bearish $NFLX or looking to hedge a stock position, here’s a look at an atm put spread down to the expected move (and the Dec low) and also an OTM put spread that starts at the expected move and takes you down to $425. Risk/reward comparison would depend on intent/conviction/fear.
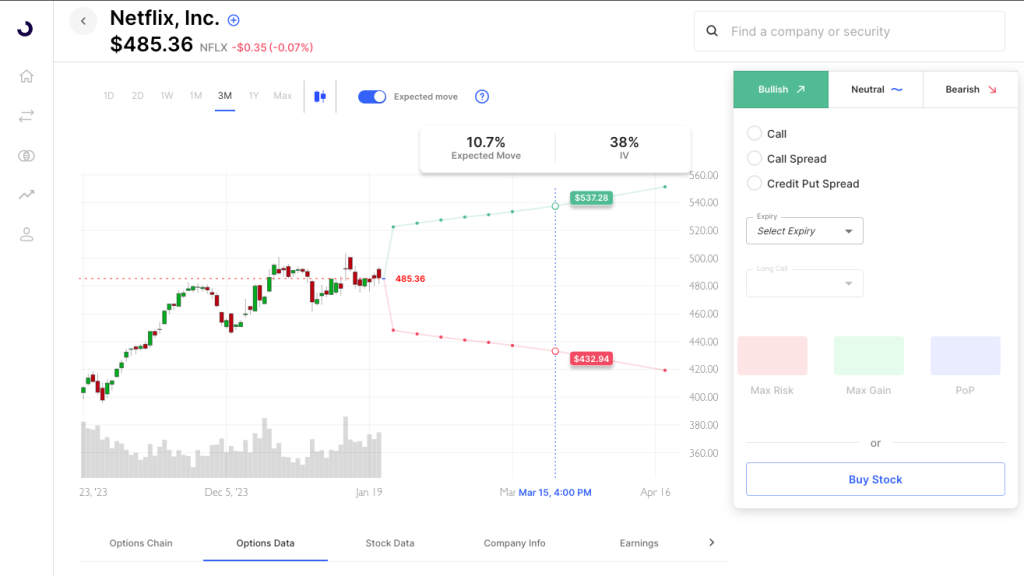
Finally, for the $NFLX bulls (and this would apply to medium to longer term bears as well). The IV set-up is such that going out in time is not very penalizing. This week’s IV is about 112, Feb is about 48, and March is about 38. To put that into a stock move perspective, the expected move for this week, is 7.7%, while the expected move out til March 15th (nearly two months) is about 10.7%.
A 50 wide debit call spread to the $540 level (roughly the bullish consensus for March) costs about 1700 to make up to 3300 with a breakeven of about $507. So you’d likely need the stock higher on earnings, but even if it got stuck at $500 for a bit, there would be time for it to get through to the upside. IV would likely decline in March a small bit in that scenario but the short call of the spread would help lessen that a tad. Charts below:

Follow The Orbit on Twitter and Youtube
Based upon publicly available information derived from option prices at the time of publishing. Intended for informational and educational purposes only and is not any form of recommendation of a particular security, strategy or to open a brokerage account. Options price data and past performance data should not be construed as being indicative of future results and do not guarantee future results or returns. Options involve risk, including exposing investors to potentially significant losses and are therefore not suitable for all investors. Option spreads involve additional risks that should be fully understood prior to investing. Securities trading is offered through Options AI Financial, LLC, member FINRA and SIPC