
Hello!
Earnings Season
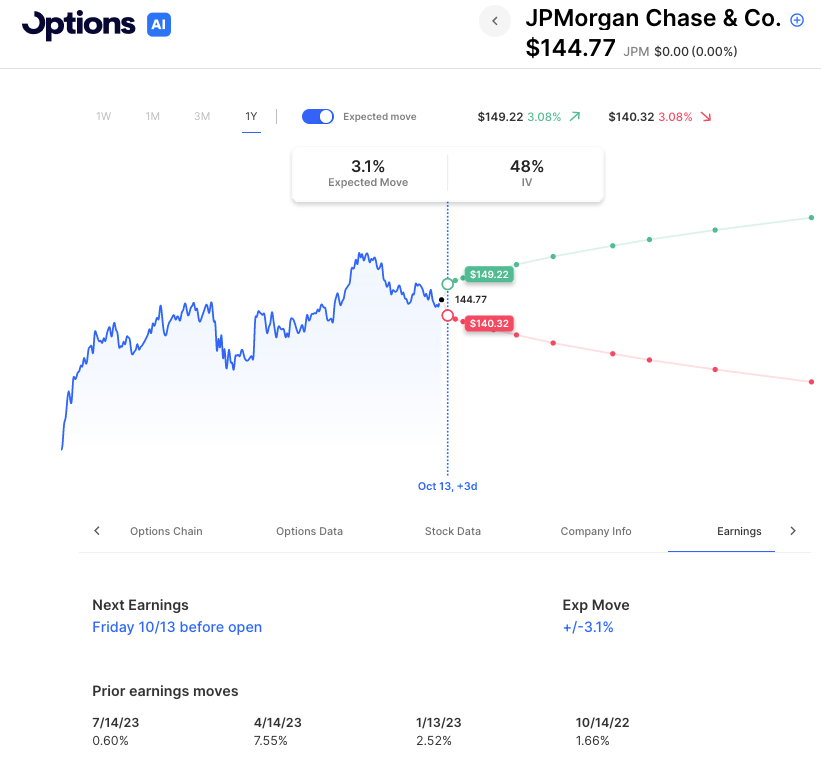
Earnings season kicks off in earnest on Friday with banks such as JP Morgan, Citi and Wells Fargo. Let’s look at JPM’s set-up. Options are pricing about a 3.1% move. That’s more than 3 of the past 4 earnings actual moves, but the stock did have a move of nearly 8% in April on earnings. That 3 for 4 of the stock staying within its expected move makes sense as stocks tend to move with or stay within their earnings expected move about 65-75% of the time. Studies have shown that the number is higher (where the expected move was more than the actual move) when IV is high, and the number is lower, when IV is low. This makes sense as the more move that is expected, the larger the range for a stock to stop in. As far as the visual expected move shown below, this is another useful way to use the expected move, and compare to recent or important levels of support or resistance. In other words, is there more to the expected move’s level than just the expected move? Are there also other technical factors at that level?
For instance, JPM’s upper expected move of 149.22 is roughly at the same level as the stock’s most recent upper range level from Sept 18th. Its bearish expected move of 140.32 is near the stock’s 200 day moving average.
Finally, another thing that can be helpful to look at prior to earnings is whether there is heavy open interest at nearby strikes in the stock. In JPM’s case that open interest is mostly near the money on the 145 strike and on the upside is at 150. In other words, on a very small 145 could act as a small magnet, and on a move to the upside the open interest on the 150 line could act as resistance.
These are just several factors from the options market that can be helpful going into an earnings event and analyzing risk/reward, strategy, and strike selection on new or existing trades. It’s good to have a checklist before selling the move or positioning directionally to get a gut level check of how far the stock could move.
Trending/Active Today
- Akero Therapeutics Inc (AKRO) -62.79%
- Palantir Technologies Inc Cl A (PLTR) +2.56%
- Rivian Automotive Inc Cl A (RIVN) +3.30%
- Unity Software Inc (U) +6.16%
- 89Bio Inc (ETNB) -33.81%
- Pepsico Inc (PEP) +0.77%
- Jd.com Inc ADR (JD) +1.88%
- Meta Platforms Inc (META) +0.26%
- Coherent Corp (COHR) +13.23%
Today’s Earnings Highlights:
- PepsiCo, Inc. (PEP) Expected Move: 3.04%
- AZZ Inc. (AZZ) Expected Move: 7.50%
Economic Calendar:
- At 06:00 PM (EST) Fed Daly Speech Impact: Medium
- At 01:30 PM (EST) Fed Waller Speech Impact: Medium
On the Scanner
- Overbought (RSI): UNG (70), UNH (69), ZS (64), VRT (64), FL (63), META (63), TBT (63), BTU (63), GOOGL (61), UUP (61), NRG (60), MSFT (57)
- Oversold (RSI): DG (22), MCD (22), KO (23), TGT (24), JETS (26), PG (26), LOW (27), LUV (29), KSS (30), CHWY (30), SCHW (30), DAL (30), CCL (30)
- High IV: SRPT (+459%), PEP (+151%), PG (+147%), IBM (+147%), MCD (+142%), PFE (+142%), JBLU (+140%), LUV (+138%), JETS (+137%), AAL (+133%), UAL (+133%)
- Unusual Options Volume: SHEL (+654%), PACW (+650%), VFC (+624%), PLTR (+536%), UAL (+511%), PEP (+441%), META (+405%), DAL (+391%), EWJ (+391%), KO (+359%), USO (+346%), OXY (+337%), QQQ (+291%), NFLX (+291%)
Economic Calendar (this week)
Wednesday
- 830am PPI
- 2pm FOMC Minutes
Thursday
- 830am CPI
- 830am Initial Jobless Claims
Friday
- 1030am UoM Consumer Sentiment
Earnings Calendar
Thursday
- INFY Infosys Limited 4.7%
- DAL Delta Air Lines, Inc. 4.4%
- WBA Walgreens Boots Alliance, Inc. 6.9%
- DPZ Domino’s Pizza, Inc. 6.0%
Friday
- UNH UnitedHealth Group Incorporated 2.8%
- JPM JPMorgan Chase & Co. 3.2%
- WFC Wells Fargo & Company 4.2%
- BLK BlackRock, Inc. 3.4%
- PGR The Progressive Corporation 4.2%
- C Citigroup Inc. 4.0%
- PNC The PNC Financial Services Group, Inc. 4.3%
Full list here: Options AI Earnings Calendar
Based upon publicly available information derived from option prices at the time of publishing. Intended for informational and educational purposes only and is not any form of recommendation of a particular security, strategy or to open a brokerage account. Options price data and past performance data should not be construed as being indicative of future results and do not guarantee future results or returns. Options involve risk, including exposing investors to potentially significant losses and are therefore not suitable for all investors. Option spreads involve additional risks that should be fully understood prior to investing. Securities trading is offered through Options AI Financial, LLC, member FINRA and SIPC