A Picture is Worth a Thousand Numbers.
Enhanced chart overlays to clearly define where a stock needs to move for any options position to be profitable. Giving you a whole new way to see option spreads.
Chart Zones Explained
Options AI’s light green zone shows where a stock needs to move by expiration to achieve Max Gain.
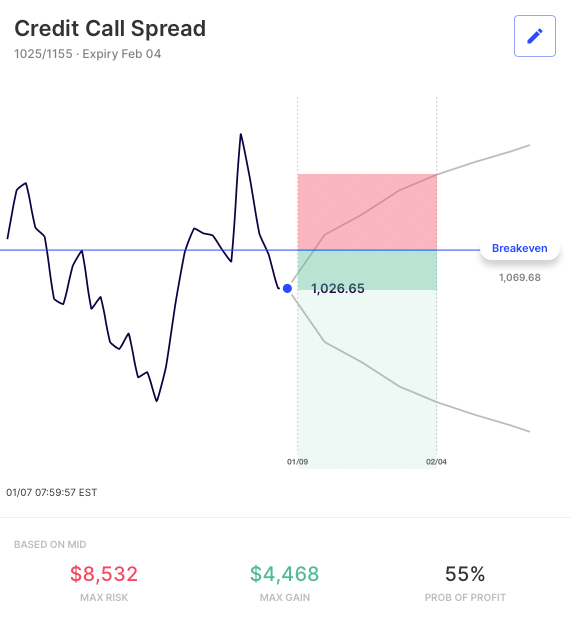
Compare the zones on the Debit Call Spread and Credit Call Spread Below (which use the same strikes and have the same breakeven level):
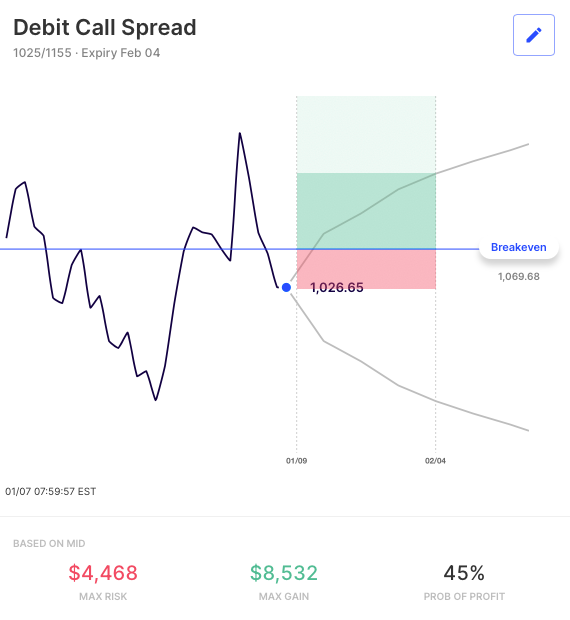
For the directional trader having bought the Debit Call Spread, the stock needs to rise above the breakeven level and into the green by expiration. The light green zone gives a clear picture of just how far the stock needs to rise for the position to be max gain.
For the income trader having sold the Credit Call Spread, the green zones represent where the stock needs to stay below and remain (at expiration) for the position to be profitable – with the light green zone being Max Gain.
In both cases, the stock in the white zone at expiry means the worst case scenario – Max Loss.
Position Management
The zones can also be an instant gut check of how an open position is doing and to plan your next move.
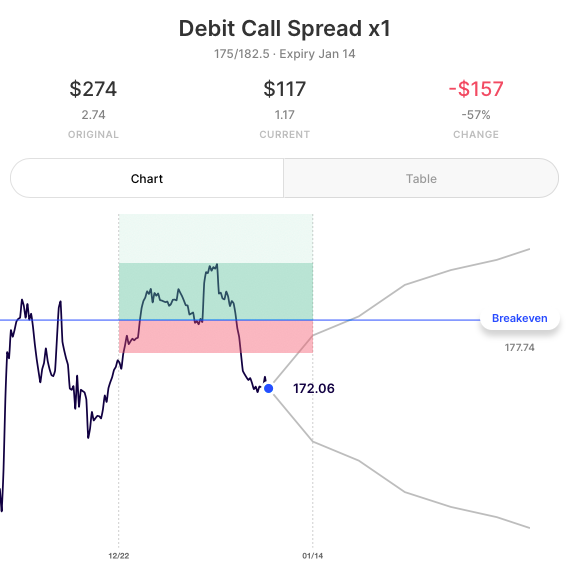
Here’s an example of a Debit Call Spread where the stock has risen above Max Gain side by side to a Debit Call Spread where the stock has gone lower, leaving the entire trade is out-of-the money:
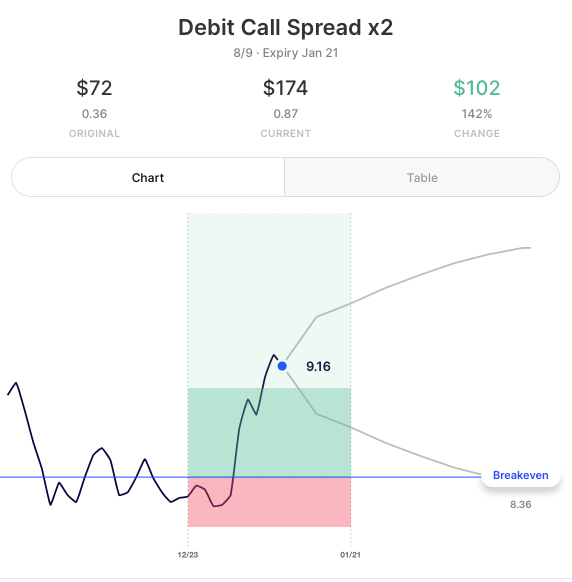
The Debit Call Spread that is in the Max Gain zone would see Max Gain on the trade at expiry. The trader would need to assess the likelihood of that to determine whether to take profits early or wait for Max Gain towards expiry.
In the case of the Debit Call Spread in the Max Loss zone, the trader needs to assess whether the stock could move higher enough by expiry to have a better outcome or whether closing the trade for less than Max Loss before then is more prudent.
Chart Interactions
On every chart, hovering or swiping will show the profit or loss (at expiry) at that stock level. On the Position Page a new toggle reveals updated probabilities and other real-time metrics: